
Introduction
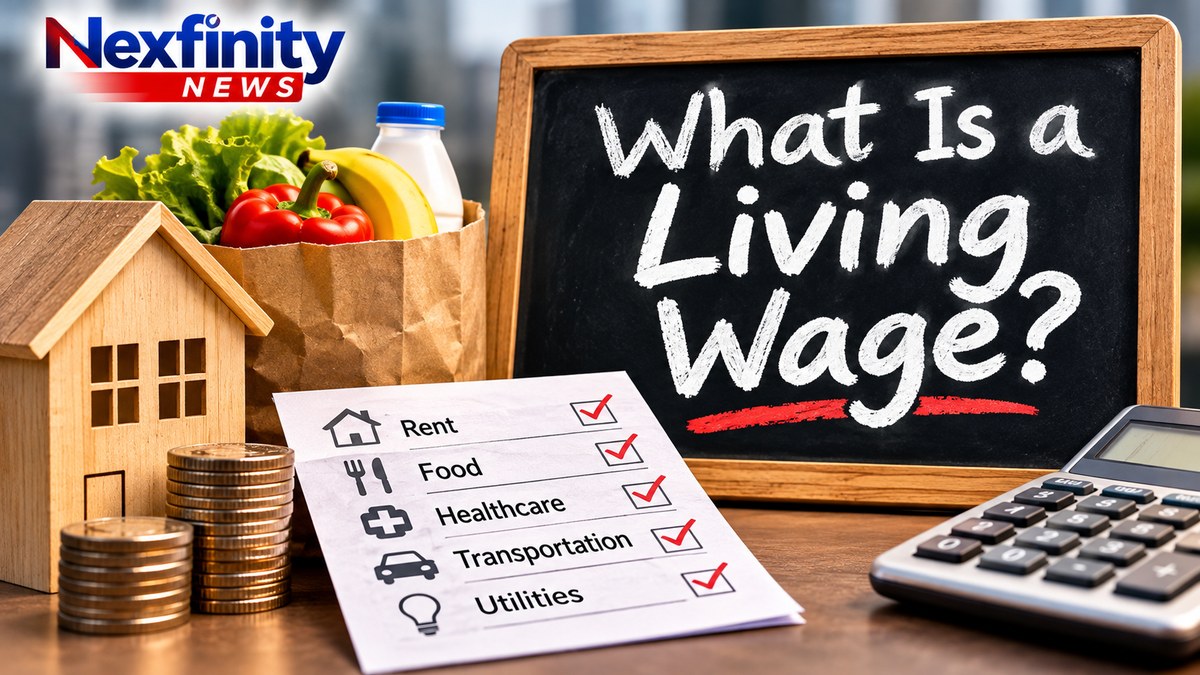
“Living wage” shows up in campaign platforms, union contracts, corporate sustainability reports and city ordinances. It is used as if its meaning were settled. It is not.
Ask most people what a living wage should cover and the first answers line up: food, shelter with utilities, and health care. Past those three basic needs, agreement breaks down quickly.
Is a smartphone a necessity, and if so, an iPhone or a basic Android? Does a living wage pay for meals ordered through delivery apps? Gambling apps, cannabis, cigarettes or alcohol? Private university tuition? A late-model vehicle instead of a used one?
This article examines who has actually defined the term, what those definitions include and exclude, how falling marriage rates change the math, whether a worker’s ability to read, write and do math should factor into the number, and what paying a living wage to under-prepared graduates costs employers.
Background: From “Decent Living” to a Grocery Bill
The traditional core of a living wage is three basic needs: food, shelter with utilities, and health care. The American version of the idea dates to the New Deal.
When Franklin D. Roosevelt signed the National Industrial Recovery Act in June 1933, he said that by living wages he meant “more than a bare subsistence level I mean the wages of decent living.” As Pepperdine’s School of Public Policy has noted, Roosevelt framed the term as the opposite of “starvation wages,” not as a specific budget.
That idea never became law in that form. The Supreme Court struck down the 1933 act in 1935. The Fair Labor Standards Act of 1938 created a federal minimum wage instead a number set by Congress, not a calculation of what living costs. The federal minimum has been $7.25 an hour since 2009.
The closest thing Washington built to a needs-based standard came in 1963. Mollie Orshansky, an economist at the Social Security Administration, took the cost of the Agriculture Department’s cheapest food plan and multiplied it by three, because a 1955 survey showed families spent about a third of their after-tax income on food. That formula, adjusted for inflation, still underpins the federal poverty thresholds.
In simple terms: the official poverty line was built from a grocery bill. Orshansky herself described it as a measure of when income was inadequate not a measure of what is adequate.
Has Anyone Actually Defined It? Yes Three Ways
The answer to “has anybody ever defined a living wage” is yes. The problem is that the definitions agree on the purpose and disagree on the shopping list.
The International Labour Organization (2024). For most of its history, the ILO had no agreed definition. That changed when a tripartite panel of government, employer and worker experts met in Geneva in February 2024, and the ILO Governing Body endorsed its conclusions on March 13, 2024. The ILO now calls a living wage “the wage level necessary to afford a decent standard of living” for workers and their families, adjusted for each country’s circumstances and based on normal working hours. It does not list what “decent” includes.
The Global Living Wage Coalition (Anker methodology). The coalition Fairtrade International, Rainforest Alliance, Social Accountability International and the ISEAL Alliance built its definition from more than 60 earlier ones. Its list of elements is broader than the traditional three: food, water, housing, education, health care, transportation, clothing, and other essentials, including a cushion for unexpected events. Its calculations look for relatively inexpensive ways to reach a basic but decent standard.
The MIT Living Wage Calculator (United States). The most-cited U.S. tool, now run by the Living Wage Institute, prices eight categories plus taxes: food, housing, health care, childcare, transportation, internet and mobile, civic engagement, and other necessities. Its methodology page is unusually specific about sources and exclusions.
| MIT category | What it is priced from | Explicitly excluded |
| Food | USDA Low-Cost Food Plan; assumes every meal is cooked at home | Restaurant meals, food not prepared at home |
| Housing | HUD Fair Market Rents, 40th percentile | |
| Health care | Employer-plan premiums plus average out-of-pocket costs | |
| Transportation | Federal spending data on used vehicles, gas and transit | |
| Internet and mobile | Lowest-cost internet plans; average cellular spending | |
| Civic engagement | Average spending on reading, admissions, pets, hobbies, entertainment | Holidays, vacations |
| Other necessities | Clothing, household supplies, personal care, furnishings | Savings, retirement, investments |
In simple terms: a living wage is not the same as a minimum wage. A minimum wage is a legal floor set by lawmakers. A living wage is an estimate of what a basic budget costs. In New York, the legal floor is $17.00 an hour on Long Island, in New York City and in Westchester, and $16.00 elsewhere.
Examples: Testing the Contested Items
Measured against the published standards, most of the disputed items fall outside a living wage. The smartphone is the exception but only as a basic device.
| Item | Inside the standard? | Basis |
| Smartphone | Yes, at the low-cost tier | MIT prices mobile service and the cheapest internet plans; no standard names a device or brand |
| iPhone vs. basic Android | Basic device | Every framework prices the least expensive way to meet a need |
| Food delivery apps | No | MIT assumes all meals are cooked at home |
| Gambling apps, cannabis, cigarettes, alcohol | No | None of the three frameworks lists them |
| Private university tuition | No | GLWC’s Anker method prices education only through secondary school; MIT includes no tuition line |
| Premium or late-model vehicle | No | MIT transportation is built on used-vehicle, gas and transit spending |
The phone. Public policy already treats a phone as a necessity. The FCC’s Lifeline program has subsidized phone and broadband service for low-income households for decades, now with a discount of up to $9.25 a month and federal minimum service standards. Pew Research Center found 91% of U.S. adults owned a smartphone in 2025, and lower-income adults are more likely to rely on one as their only internet connection. Job applications, banking, school portals and two-factor logins all assume one. The standards price the function, not the brand. A worker can still buy an iPhone; the living-wage figure simply is not built on what one costs.
Delivery apps. MIT’s food budget is the USDA Low-Cost Food Plan, with every meal assumed to be prepared at home. Restaurant and takeout meals are specifically excluded. By that measure, a DoorDash or Uber Eats habit is a discretionary purchase.
Gambling, cannabis, cigarettes and alcohol. None appears in any of the three frameworks. Federal benefit programs have drawn the same line for decades: SNAP has barred alcohol and tobacco purchases since 1964. Starting in 2025, the Agriculture Department went further, approving waivers in 23 states to also restrict soda, candy and similar items. On June 22, 2026, a federal judge vacated the waivers in five of those states, ruling USDA lacked authority to narrow the legal definition of food. USDA has appealed; the waivers in the other 18 states remain in effect. Whether a wage money a worker earns should be judged by the same standard as a benefit funded by taxpayers is a separate question, and a contested one.
Private universities and premium cars. The coalition’s Anker methodology prices children’s education through secondary school, not college tuition. MIT’s transportation line is built from spending on used vehicles, gasoline and public transit. Both standards point to the least expensive adequate option.
Impact: “Living,” “Decent” and “Comfortable” Are Three Different Numbers
The word chosen changes the figure dramatically, and published numbers often blur the difference.
A November 2026 SmartAsset analysis took MIT’s living-wage figures and treated them as only half of a household budget, adding 30% for discretionary spending and 20% for savings. The result: a single adult would need at least $80,000 a year to live “comfortably” in every state, and $124,342 in New York.
That is not a living wage. It is roughly double one, because it adds back exactly what MIT leaves out leisure and savings. Even groups that use MIT’s numbers adjust them: the Agricultural Justice Project tells employers to add 10% because its own standard includes savings.
In simple terms: when a politician, employer or advocate cites a “living wage” figure, the first question is whose basket of goods it prices. A full-time New York minimum-wage job on Long Island pays $35,360 a year before taxes ($17 × 2,080 hours). Whether that is a living wage depends entirely on which definition is applied.
The Household Question: A Family Wage in a Single-Earner Country
How many earners share a household is one of the largest drivers of what a living wage must cover, and one of the least discussed.
A living wage is calculated per household, not per person. Rent, utilities, internet and a car cost roughly the same whether one adult pays or two. A second earner splits those fixed costs. A single earner carries all of them, which is why the MIT calculator publishes separate figures for one and two working adults.
More Americans now carry those costs alone:
| Measure | Then | Now | Source |
| Adults 25–54 who are married | 67% (1990) | 53% (2019) | Pew Research Center |
| One-person households, share of all households | 20% (1975) | 29% (2025) | Census Bureau |
| Married couples, share of all households | 66% (1975) | 47% (2025) | Census Bureau |
The gap shows up in how people say they are doing. Pew found 64% of unpartnered adults said they were doing at least OK financially, compared with 77% of partnered adults.
The original living wage assumed one earner. When Pope Leo XIII’s 1891 encyclical Rerum Novarum and later Roosevelt argued for living wages, the model was largely a family wage: one breadwinner supporting a household. Today two incomes are the norm for couples raising children. Among married-couple families with children, both parents were employed in 66.3% of families in 2025, according to the Bureau of Labor Statistics.
Some economists argue the shift to two incomes helped push housing prices up, as two-earner households bid against one another. Elizabeth Warren made that case in The Two-Income Trap (2003), and it remains debated. If it holds, a single earner today is competing for housing priced for two paychecks.
In simple terms: the living wage was designed for a one-earner family, while today’s housing market may be priced for a two-earner one. A single adult sits on the wrong side of both.
The causation runs both ways. Economic strain likely discourages marriage as well as following from its absence. Pew found 44% of adults without a high school diploma are unpartnered, compared with 30% of those with at least a bachelor’s degree. Rising housing, health care and childcare costs would sharpen the issue even if household structure had not changed, and part of the rise in solo households reflects older adults living alone.
Analysis: Should Reading, Writing and Math Factor In?
Under every definition reviewed here, a worker’s skills do not change the living-wage number. That is by design and it is the core of the disagreement.
Two different ideas get called “wages.” A living wage is needs-based: it asks what rent, groceries and insurance cost in a given place. A market wage is productivity-based: it reflects what a worker’s output is worth to an employer. Literacy and numeracy shape the second. They do not change the price of the first.
The skills gap is real and growing. The 2023 Survey of Adult Skills (PIAAC) found 28% of U.S. adults ages 16 to 65 scored at Level 1 or below in literacy, up from 19% in 2017. In numeracy, 34% scored at that level, up from 29%. ProLiteracy puts those shares at roughly 59 million and 72 million adults.
The ILO definition leaves a door open on this question. It says a living wage should reflect “country circumstances,” and the 2024 conclusions call for living-wage estimates to be used alongside economic factors, naming productivity levels and the economic sustainability of enterprises. That applies to how a nation sets wage policy, not to individual workers.
The case for a needs-only standard. Rent costs the same whether or not the tenant reads at grade level. Supporters argue weak skills reflect failures of the school system, and that workers should not absorb that cost through pay that cannot cover basic needs.
The case for tying pay to skills. Employers pay for output. Critics argue that requiring wages above what a job produces leads employers to hire fewer of the lowest-skilled workers, or to automate. Economists still dispute how large that effect is.
There is a less-discussed link. The MIT budget quietly assumes the earner cooks every meal on a low-cost food plan, finds the cheapest internet plan and manages a tight monthly budget. Each of those tasks depends on reading and arithmetic. In simple terms: a living-wage budget works only for someone with the skills to live on it.
The Employer’s Side: Paying for Skills That Aren’t There
For employers, the strain is not only the wage rate. It is the gap between what an entry-level hire costs and what that hire can do on day one and that gap is widening among new high school graduates.
What graduates bring. The 2024 National Assessment of Educational Progress tested high school seniors months before graduation. 45% scored below NAEP Basic in math and 32% below Basic in reading, the largest shares ever recorded. Only 22% reached Proficient in math and 35% in reading. NAEP’s own example of a Basic-level 12th-grade math skill is finding the probability of a simple event from a two-way table; students below Basic generally fall short of that.
In simple terms: close to half of graduating seniors fall short of the lowest math benchmark on the national test. One caveat: NAEP Proficient is a higher bar than grade-level proficiency on most state tests, so Below Basic is the more telling number.
What employers can absorb. Entry-level hiring is concentrated in low-margin industries. In the restaurant sector, the National Restaurant Association reports labor at a median 36.5% of sales for full-service operators, against median pretax income of 2.8% of sales (4.0% for limited-service). In its 2026 State of the Industry report, the association said 42% of operators were not profitable in 2025, up from 29% in 2024.
The arithmetic is unforgiving. At those medians, a 10% increase in labor costs equals 3.65% of sales more than a typical full-service restaurant’s entire pretax margin, unless prices rise to cover it.
What training costs. Employers already spend heavily to close skill gaps. U.S. organizations spent an average of $874 per learner in 2025, according to Training magazine. Smaller firms in the survey spent $1,091 per learner, more than double the $468 at large corporations, because fixed program costs spread across fewer workers. The survey covers organizations with 100 or more employees; the smallest employers are not in it.
When a wage floor rises, an employer hiring an under-prepared graduate pays twice: a higher wage from the first hour, plus the cost of teaching skills school did not.
How businesses respond. Employers have four main levers, and each lands differently on low-skill workers:
- Raise prices. Average restaurant menu prices rose 36% between February 2020 and May 2026, roughly matching what operators needed to hold pre-pandemic margins.
- Hire fewer people. The Congressional Budget Office estimated that a $17 federal minimum phased in by July 2029 would raise pay for millions and reduce the number of people in poverty by 400,000, but leave about 700,000 more workers jobless under its average estimate. Economists at the Economic Policy Institute and elsewhere argue the CBO overstates job losses.
- Automate. Ordering kiosks, self-checkout and scheduling software substitute for the entry-level tasks most often given to new hires.
- Raise the hiring bar. Employers paying more expect more, and can screen for experience or credentials. That protects the business but pushes the least-prepared graduates further back in line.
The other side. Supporters of living wages argue higher pay reduces turnover, which cuts hiring and training costs. They also argue the skills problem is a public-school failure that employers did not create and workers should not pay for through lower wages. They point to a 2026 GAO update finding that about two-thirds of working adults on Medicaid and SNAP work full time meaning taxpayers already cover part of the gap.
The tension is real on both ends. A living wage is set by what life costs. An employer’s ability to pay it is set by what the work produces. For a growing share of new graduates, those two numbers are moving apart.
Conclusion
The living wage has been defined by the ILO in 2024, by the Global Living Wage Coalition and, in dollar terms, by the MIT calculator. What has never been settled is the word “decent.”
The published standards share a core that has grown past the original three needs. Modern versions add transportation, a phone and internet, clothing and childcare. They also share their exclusions: restaurant and delivery meals, vices, luxury goods, private tuition and, in MIT’s case, savings.
The argument is less about whether a living wage can be defined than about who gets to define “decent” and whether skills belong anywhere in the formula. Readers who see a living-wage figure should ask one question: whose basket of goods does it price?
Key Takeaways
- The traditional core of a living wage is food, shelter with utilities and health care. Modern standards add transportation, phone and internet, clothing and childcare.
- The ILO adopted its first agreed definition in March 2024. It defines the goal, a “decent standard of living,” but not a list of goods.
- MIT’s U.S. calculator excludes restaurant meals, leisure, vacations and savings, and prices the cheapest adequate option in each category.
- A smartphone falls inside the published standards as a basic device. Delivery apps, gambling, cannabis, tobacco, alcohol, private tuition and premium cars do not.
- “Living,” “decent” and “comfortable” produce very different numbers. SmartAsset’s comfortable-living estimate for a single adult in New York is $124,342.
- Skills do not change the living-wage figure under any definition reviewed. With 28% of U.S. adults at the lowest literacy levels, the gap between needs-based and productivity-based pay is a growing policy question.
- The living wage began as a family wage for one earner. Today 29% of households are one person and only 53% of adults 25 to 54 are married, so more workers carry fixed costs alone.
- 45% of 2024 high school seniors scored below Basic in math. For low-margin employers such as restaurants, with median pretax income of 2.8% to 4.0% of sales, paying a living wage while training under-prepared hires is a real squeeze.
Sources
- ILO reaches agreement on the issue of living wages International Labour Organization, March 15, 2024
- Report of the Meeting of Experts on wage policies, including living wages ILO Governing Body, March 2024
- Anker living wage and living income reference values Global Living Wage Coalition
- Anker Reference Value methodology summary IDH / Anker Research Institute
- How to measure living wage: 10 things you should know ISEAL Alliance
- Living Wage Calculator: FAQs and Methodology MIT / Living Wage Institute
- Statement on N.I.R.A., June 16, 1933 The American Presidency Project
- What Did FDR Mean by a Living Wage? Pepperdine School of Public Policy
- Fair Labor Standards Act U.S. Department of Labor
- The Development and History of the Poverty Thresholds Gordon M. Fisher, Social Security Bulletin
- Measuring Poverty: Who Is Poor? Federal Reserve Bank of Boston
- New York State’s Minimum Wage New York State
- Lifeline Program for Low-Income Consumers FCC
- Mobile Fact Sheet Pew Research Center, 2025
- Federal district court vacates USDA SNAP food restriction waivers Covington & Burling, June 2026
- USDA appeals SNAP waiver ruling Feedstuffs
- Here’s the salary it takes to live comfortably in each US state in 2026 SmartAsset via Stacker, Nov. 1, 2026
- Living Wage Calculator note Agricultural Justice Project
- Rising Share of U.S. Adults Are Living Without a Spouse or Partner Pew Research Center, Oct. 5, 2021
- Share of U.S. adults living without a romantic partner has ticked down Pew Research Center, Jan. 8, 2025
- America’s Families and Living Arrangements: 2025 U.S. Census Bureau, Dec. 2, 2025
- Employment Characteristics of Families 2025 Bureau of Labor Statistics, April 2026
- Highlights of the 2023 U.S. PIAAC Results NCES, December 2024
- US adults need stronger skills to thrive ProLiteracy
- 5 Takeaways from 12th Grade NAEP Math and Reading Results National Assessment Governing Board
- 2024 NAEP Mathematics Assessment, Grade 12 National Center for Education Statistics
- NAEP scores for class of 2024 show major declines Chalkbeat, Sept. 9, 2025
- New Resource Provides Insights into Operational Realities National Restaurant Association, Aug. 20, 2025
- National Restaurant Association CEO: Cautious optimism for growth in 2026 Nation’s Restaurant News, Feb. 26, 2026
- NRA: Rising costs continue to squeeze restaurant profitability Bar & Restaurant
- 2025 Training Industry Report Training magazine, November 2025
- The Budgetary and Economic Effects of S. 2488, the Raise the Wage Act of 2023 Congressional Budget Office, December 2023
- Federal Social Safety Net Programs (GAO-26-108703) U.S. Government Accountability Office, 2026