

American investors now owe their brokers a record $1.5 trillion.
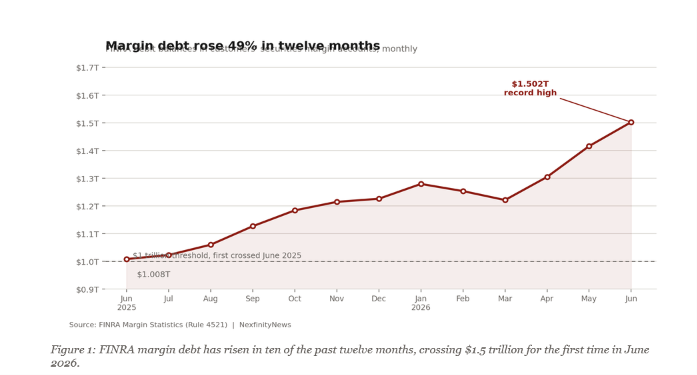
That figure comes from the Financial Industry Regulatory Authority’s margin statistics, which reported $1,502,072 million in debit balances in customers’ securities margin accounts for June 2026. It was a 6.1% increase from May and a 49.0% increase from a year earlier, and the highest reading in a series that runs back to January 1997.
A second figure is arguably more striking. Net investor credit — free cash balances in brokerage and margin accounts minus what investors owe on margin — fell to approximately negative $1.06 trillion in June, a record low. In simple terms: the gap between what retail investors own outright and what they owe against it has never been wider.
Leverage records are not, by themselves, predictions. But the pace of the current increase places the market in company it has kept only three times in three decades: late 1999, mid-2007, and the spring of 2021.
Background: What Margin Debt Measures
Margin debt is money investors borrow from their broker-dealer, using the securities in their margin account as collateral. It lets an investor control a larger position than their cash alone would allow, magnifying gains on the way up and losses on the way down.
FINRA collects the data monthly from member firms under Rule 4521(d) and publishes it in aggregate, generally in the third week of the month following the reference month. The series is the cleanest publicly available read on how much borrowed money is riding on U.S. equities.
Two features of the data shape how it should be read.
First, it is stale on arrival. FINRA figures are several weeks old by the time they are published, which limits their usefulness as a real-time signal.
Second, the dollar level rises mechanically as markets rise. Bigger portfolios support bigger loans. A nominal record, on its own, tells you little. Analysts who follow the series — including Jennifer Nash at Advisor Perspectives, which maintains the chart series originated by Doug Short — focus instead on the rate of change and on the divergence between margin debt growth and market growth.
By that measure, the divergence is now historically wide. Advisor Perspectives calculates that inflation-adjusted margin debt has grown roughly 604% since 1997, against 354% for the market itself. Over the twelve months through May, Leuthold Group data cited by Investing.com put S&P 500 total return at about 22% — roughly half the rate at which margin borrowing expanded.
FINRA margin debt, month by month
| Month | Margin debt ($ millions) | Change from prior month |
|---|---|---|
| Jun 2026 | 1,502,072 | +6.1% |
| May 2026 | 1,415,557 | +8.5% |
| Apr 2026 | 1,304,281 | +6.8% |
| Mar 2026 | 1,220,922 | -2.6% |
| Feb 2026 | 1,253,192 | -2.0% |
| Jan 2026 | 1,279,042 | +4.4% |
| Dec 2025 | 1,225,597 | +0.9% |
| Nov 2025 | 1,214,321 | +2.6% |
| Oct 2025 | 1,183,654 | +5.1% |
| Sep 2025 | 1,126,494 | +6.3% |
| Aug 2025 | 1,059,723 | +3.6% |
| Jul 2025 | 1,022,548 | +1.4% |
| Jun 2025 | 1,007,961 | — |
Source: FINRA Margin Statistics. Debit balances in customers’ securities margin accounts.
The Regulatory Framework
The rules governing margin borrowing were written in direct response to the 1929 crash, when investors could buy stock with as little as 10% down and the ensuing forced liquidations turned a decline into a collapse.
Under the Federal Reserve’s Regulation T, established through the Securities Exchange Act of 1934, an investor may borrow no more than 50% of the purchase price of a marginable security. FINRA Rule 4210 sets a maintenance requirement of 25% equity, and most brokerages impose stricter “house” requirements above that floor. FINRA tightened intraday margin requirements in a rule change taking effect this year.
The mechanism that matters in a downturn is the margin call. When account equity falls below the maintenance threshold, the broker demands additional cash or securities. If the investor does not meet the call, the broker liquidates positions — regardless of the investor’s view of value or timing.
That is the feedback loop the indicator is really tracking. Forced selling depresses prices, which triggers further margin calls, which forces more selling. Leverage does not cause market declines. It accelerates them.
Historical Precedent: Three Episodes
The historical pattern is consistent in direction and inconsistent in timing.
The dot-com peak. Margin debt surged through late 1999 and peaked at roughly $278 billion in March 2000, coinciding with an interim high for the S&P 500. The index’s highest monthly close that year came later, in August. From the March 2000 high, the S&P 500 fell roughly 49% over the following two and a half years; the Nasdaq Composite lost about 78%.
The housing-credit peak. A second surge began in 2006 and peaked at about $381 billion in July 2007 — three months before the S&P 500 topped in October 2007. The subsequent decline took the index down roughly 57% by March 2009. Margin debt bottomed in February 2009, the same month the market did.
The pandemic-liquidity peak. Margin debt peaked near $936 billion in October 2021, two months before the S&P 500’s December 2021 high. The index fell about 25% into October 2022. Margin debt followed, hitting its cycle low in December 2022.
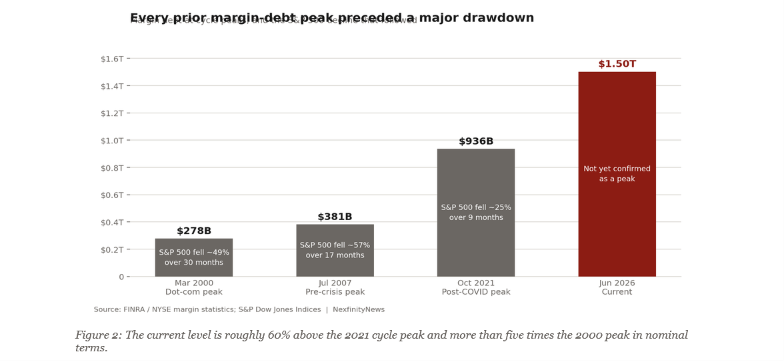
The credit-balance series tells a similar story with tighter timing. Advisor Perspectives reports that troughs in monthly net credit balance preceded S&P 500 monthly-close peaks by six months in 2000, four months in 2007, four months in 2018, two months in 2021 — and by zero months in 2025.
The trend in those numbers is not reassuring, but it is also not a forecast. Five observations do not establish a rule.
The Current Market Context
The leverage build is happening against a backdrop that has few quiet corners.
The S&P 500 has gained roughly 8% to 9% year to date, following a second quarter that delivered a 15.2% gain — the strongest quarter in six years — driven overwhelmingly by artificial intelligence and AI infrastructure names. Forward price-to-earnings ratios sit around 20 to 21 times, in the 87th percentile of readings since 1980, according to Goldman Sachs Research. The ten largest S&P 500 companies account for roughly 40% of the index’s market capitalization.
Concentration cuts both ways. In June, the S&P 500 slipped 1.0% while the Magnificent Seven fell approximately 12.7% collectively, as investors questioned whether the hundreds of billions in AI capital expenditure would convert to proportional revenue.
The monetary backdrop has also inverted. May inflation came in at 4.2%, the highest in three years. Half of FOMC officials now anticipate at least one rate increase in 2026, a reversal from March, when none did, and markets are pricing meaningful odds of a hike as soon as this quarter. Because margin loan rates float with benchmark rates, a hiking cycle would raise the carrying cost of leverage for the first time in this expansion — squeezing borrowers who are already extended.
The Federal Reserve’s own May 2026 Financial Stability Report described asset valuation pressures as elevated and vulnerabilities from financial-sector leverage as notable, with hedge fund leverage remaining high and concentrated among the largest funds. The report did not sound an alarm. It catalogued exposure.
Analysis: What the Indicator Can and Cannot Tell You
The case for taking the reading seriously rests on three points.
The growth rate, not the level, is the signal — and a 49% annual increase has only three precedents in the series, all of them late-cycle. Margin debt relative to GDP now sits near 4%, against a long-run median closer to 1.5%. And the record-negative credit balance means the cash cushion that would normally absorb a drawdown has been spent.
The case for restraint is equally concrete.
Margin debt is best understood as coincident, not leading. It rises because markets rise. Advisor Perspectives, which publishes the most-cited version of the chart, has consistently concluded that there are too few peak-trough episodes to treat the series as a reliable predictor of a major selloff.
The composition of the borrowing also matters and is invisible in the aggregate. Some portion of margin debt is not speculation at all but liquidity management by high-net-worth households borrowing against appreciated positions rather than selling and realizing capital gains. That behavior is rational, tax-driven, and not a sentiment signal.
Finally, the series is incomplete. It captures none of the leverage embedded in options positioning, leveraged and inverse ETFs, securities-based lines of credit outside margin accounts, or the derivative structures increasingly used by retail platforms. If anything, $1.5 trillion understates the total.
Impact
For individual investors, the practical exposure is straightforward: leverage removes the option to wait. An unleveraged investor who is wrong about timing can hold. A leveraged investor who is wrong about timing can be liquidated at the bottom by a broker acting entirely within its rights.
For the broader market, the concern is transmission. Concentrated index leadership plus record leverage plus a record-low cash cushion is a combination in which a decline in a small number of very large stocks can force selling in unrelated positions, because margin calls are met by selling whatever is liquid.
Conclusion
The margin debt series is not a timing tool, and the analysts closest to the data are the first to say so. What it offers is context: a measure of how much room the market has to be wrong.
By that measure, the room is narrow. Investors have never owed more against their portfolios, never held less cash against those obligations, and have not increased their borrowing this quickly outside of 1999, 2007, and 2021.
None of those three periods marked an exact top. All three marked an environment in which the market had stopped being forgiving.
Key Takeaways
- FINRA margin debt reached a record $1.502 trillion in June 2026, up 6.1% for the month and 49.0% year over year.
- Net investor credit balances fell to a record negative $1.06 trillion, meaning investors owe far more than they hold in cash.
- Comparable year-over-year growth rates have occurred only three times since 1997: late 1999–early 2000, mid-2007, and spring 2021.
- Margin debt peaked before the S&P 500 by roughly zero to three months in prior cycles — too little lead time to act on, and too few episodes to generalize from.
- The signal is the growth rate and the divergence from market growth, not the nominal dollar record, which rises with market capitalization.
- A Federal Reserve shifting toward rate increases would raise the floating cost of margin loans for the first time this cycle.
- The figure likely understates total leverage, as it excludes options, leveraged ETFs, and securities-based lending outside margin accounts.
Editor’s note: This article is reporting and analysis, not investment advice. NexfinityNews does not make investment recommendations, and its editor is not a licensed financial adviser. Readers should consult a licensed professional regarding their own circumstances.
A note on figures: Figures in this article are taken directly from FINRA’s published margin statistics. Some secondary coverage of the June 2026 release has reported a higher figure of $1.53 trillion and a 7.9% monthly gain; those numbers are inconsistent with FINRA’s own credit-balance data for the same month. NexfinityNews uses the primary source.
Sources
- FINRA, Margin Statistics (Rule 4521 monthly reporting)
- FINRA, Margin Balance Reporting: FAQs under Rule 4521(d)
- FINRA, Know What Triggers a Margin Call
- FINRA, Understanding the New Intraday Margin Requirements
- Jennifer Nash, “Margin Debt Jumps in June to Another Record High,” Advisor Perspectives, July 20, 2026
- Federal Reserve Board, Financial Stability Report, May 2026
- Mayra Rodríguez Valladares, “Fed Warning: America’s Financial System Is Strong But Risks Are Rising,” Forbes, May 9, 2026
- Goldman Sachs Global Investment Research, AI capex and S&P 500 return on equity, June 2026
- Goldman Sachs, 2026 S&P 500 outlook
- Leuthold Group data via Investing.com: investor margin borrowing surges
- Madison Investments, Monthly Market Update, July 2026
- CNBC, stock market coverage, July 27, 2026
- Forbes, outlook for the last six months of 2026