
Intro
On June 29, 2026, the Supreme Court decided Watson v. Republican National Committee and made a single piece of paper evidence enormously consequential.
The Court upheld Mississippi’s law counting mail ballots postmarked by Election Day and received up to five business days afterward. Justice Amy Coney Barrett, writing for a 5-4 majority joined by Chief Justice John Roberts and Justices Sotomayor, Kagan and Jackson, held that federal election-day statutes set the deadline for casting a vote, not for receiving a ballot. The electorate’s choice, she wrote, is made when voting is complete, not when ballots are received. (SCOTUS blog)
That ruling preserved grace periods in 14 states and the District of Columbia for all mail ballots, and in 16 more states for military and overseas voters (Voting Rights Lab). In each of them, whether a late-arriving ballot counts now turns on whether officials can establish when the voter mailed it. In practice, that means the postmark.
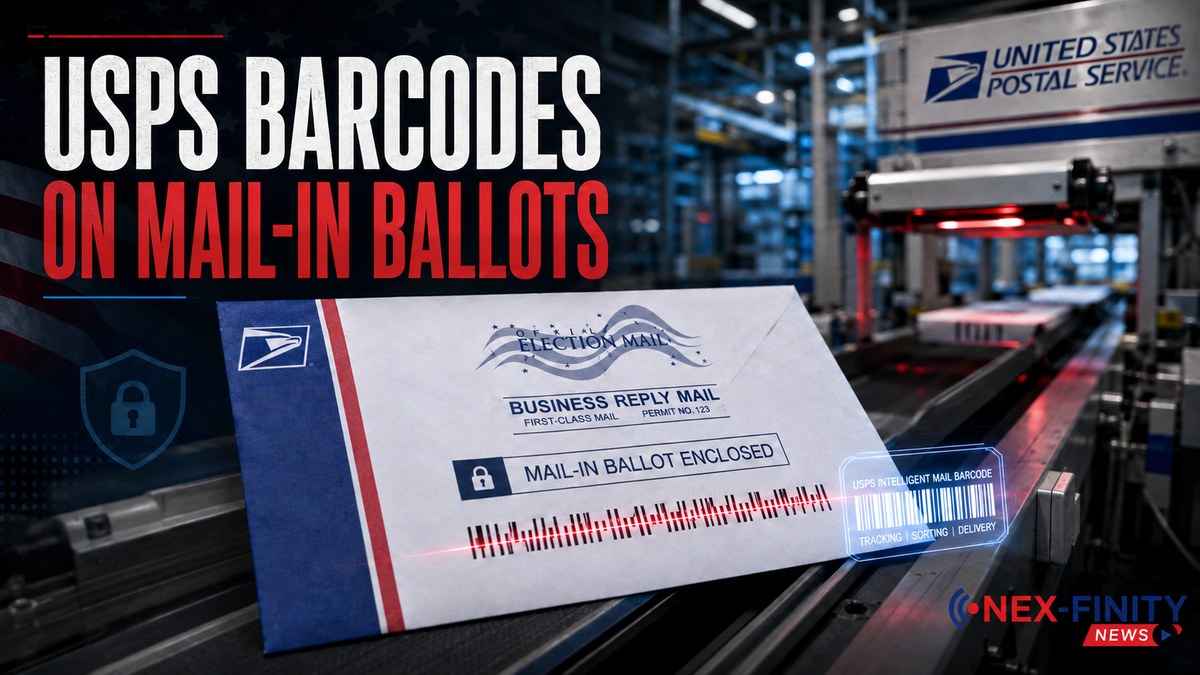
Four weeks earlier, the Postal Service had proposed a rule that would put a uniquely serialized Intelligent Mail barcode on every federal ballot envelope, outbound and return. Scanned as it moves through the postal network, that barcode generates a machine-readable record of when a mailpiece entered the system.
The rule was finalized Aug. 21 and published in the Federal Register on Aug. 26. It has been enjoined, un-enjoined and enjoined again inside of one week. Almost none of the argument over it has concerned the thing it would do best.
Background: what the Court left standing, and what it left fragile
Watson was a status-quo ruling. The Republican National Committee and the Mississippi Republican Party had argued that an 1845 federal statute establishing a uniform Election Day requires ballots to be received, not merely cast, by that date. The Fifth Circuit agreed. The Supreme Court reversed, 5-4, with Justices Alito, Thomas, Gorsuch and Kavanaugh dissenting.
The practical consequence is that roughly 30 states continue to count some ballots arriving after Election Day, provided the voter can be shown to have acted in time. Votebeat’s analysis of grace-period jurisdictions found more than 745,000 absentee ballots arrived after Election Day in 2024, amounting to no more than about 3% of the total vote in any single state.
In simple terms: the Court did not create a new rule. It declined to eliminate an old one, and in doing so left the weight of those ballots resting on the reliability of a postal cancellation mark.
The postmark is not a reliable instrument
It has not been for years, and the reasons are mundane rather than sinister.
The USPS Office of Inspector General has documented the common causes: envelopes sticking together as they run through processing equipment, and postal personnel not realizing that ballots returned in prepaid business reply envelopes still require cancellation (Brennan Center). A postmark is a byproduct of how mail is processed, not a deliberate act of recording. The Postal Service’s ongoing network consolidation has widened the gap between when a voter hands over a ballot and when the mark is applied, if it is applied at all.
The failure mode is not theoretical. In 2020, so many New York absentee ballots were invalidated for lacking postmarks that voters obtained relief in federal court, where Judge Analisa Torres ordered ballots counted after evidence showed they had been mailed on time. That same year, Virginia’s Board of Elections adopted a regulation requiring intelligent mail barcodes on absentee ballot mail — a state-level move toward exactly the instrument now at issue federally (CNN).
NexfinityNews pulled the underlying federal data to size the problem. Aggregating the U.S. Election Assistance Commission’s 2024 Election Administration and Voting Survey public-release file across all 6,461 reporting jurisdictions:
| Measure | 2024 general election |
|---|---|
| Mail ballots rejected because they arrived late | 103,441 |
| Mail ballots rejected for lacking a postmark | 1,211 (as reported) |
| Mail ballots rejected, all reasons | 584,463 |
The no-postmark figure is a floor, not a count. That field is sparsely reported: New York recorded 524 and Ohio 475, while California, Pennsylvania and Michigan — three of the largest mail-voting states — left it blank entirely. The late-arrival number, 103,441, is the more solid one, and it is roughly the same order of magnitude as the estimated 114,000 ballots rejected as late in the 2018 midterms.
What the rule would actually create
The Postal Service’s 95-page final rule requires election officials mailing ballots in federal general, special and runoff elections to use automation-compatible envelopes bearing the Official Election Mail logo and two uniquely serialized Intelligent Mail barcodes — one assigned to the outbound envelope, one to the return envelope.
Before a mailing can enter the mailstream, officials or their authorized vendors must register in a new Federal Ballot Mail Portal and upload each enrolled voter’s name, mailing address, issuing state and both barcode numbers, generally at least 30 days before a federal election. USPS would verify outbound mailings against portal records and would decline mailings that fail verification, returning them to the mailer for correction.
The barcode itself is not new technology. The 65-bar Intelligent Mail barcode is what USPS already uses to sort mail and generate tracking events, and serialized IMbs, Service Type Identifiers and the Informed Visibility platform already appear in the Postal Service’s own 2026-2027 Official Election Mail Kit. States have used them voluntarily for years. They are the infrastructure that consumer ballot-tracking services run on.
What is new is the mandatory portal, the enrollment requirement, and the Postal Service’s authority to refuse a state’s ballot mailing.
Why nobody is making the timeliness argument
Two reasons, and the first is chronological.
The rule was not written as a response to Watson. It was proposed on June 2, 2026, roughly four weeks before the decision came down, and it implements Executive Order 14399, signed March 31. The administration could not have been answering a ruling that had not yet issued.
The second reason is framing. The rule has been defended in the language of fraud prevention and law enforcement access. USPS states in the rule that the portal data would give federal law enforcement a list identifying the people states planned to send ballots to along with the identifiers for those specific mailpieces, and observes that law enforcement currently lacks that information (Biometric Update). The White House characterized the Supreme Court’s Aug. 24 order as a win for election security. President Trump has said for years that mail voting produces fraud; courts reviewing this record have repeatedly found no evidence of it.
Opponents, for their part, are litigating the portal and the gatekeeping — the parts that touch state authority over elections — not the barcode.
So the strongest functional case for the rule sits unclaimed. Whatever the intent behind it, the rule was finalized into a legal environment the Court reshaped in June, and in that environment a scan timestamp is a materially better instrument than an ink cancellation for the precise question Watson left to the states.
Three limits on how far that goes
The evidence runs in one direction. A scan establishes that a ballot was inside the postal network by a given moment. It is an upper bound on when the ballot was mailed, not a lower bound. A ballot dropped into a collection box on Election Day evening may not generate a first scan for two or three days. Scan data is therefore strong evidence for counting a late-arriving ballot and weak evidence for rejecting one. Deployed the second way, it would disqualify voters for the Postal Service’s own processing lag — the same failure the postmark already produces, in a new format.
Roughly a third of returned ballots never enter the mailstream. In 2024, 14,933,114 of 47,957,093 returned mail ballots — 31.1% — came back through a drop box. The share is highest in the states that mail the most ballots: Utah 80.3%, Washington 66.6%, Oregon 64.8%, the District of Columbia 57.1%, California 47.0%, Nevada 44.8%. No postal scan exists for any of them, because no postal handling occurred. A barcode-based timeliness record covers the mailed subset only.
The statutes say “postmark.” State grace-period laws are written around a postmark, not a tracking event. Virginia moved in 2020; most states have not. A scan record is not self-executing as legal proof of timely mailing without a statutory or regulatory change at the state level, which the federal rule does not reach.
The severability point
The tracking function and the contested machinery are separable, and that is the sharpest criticism available of the rule as written.
A rule that standardized ballot envelope barcodes and guaranteed election officials access to scan data as evidence of timely mailing would deliver the audit-trail benefit. It would not require a federal database mapping voters to home addresses to tracking identifiers. It would not make the Postal Service a gatekeeper with authority to refuse a state’s ballot mailing. It would likely not have drawn 25 state attorneys general into court.
The version published Aug. 26 bundles all of it together. Judge Indira Talwani’s Aug. 27 restraining order does not enjoin the barcode standard in isolation; it blocks core parts of a rule she found the Postal Service likely lacked statutory authority to issue at all.
The other question: mail ballots against voter rolls
A separate critique of mail voting runs alongside this one and is frequently blended into it — that bloated registration lists push unrequested ballots to stale addresses. It is a different question with a different data trail, and the barcode does not answer it. We ran the numbers.
Two EAVS fields sit at the center, and they are not the same thing: mail ballots actually transmitted, and names on the rolls, split between active and inactive registrations.
In simple terms: “inactive” is not a synonym for “dead file.” Under the National Voter Registration Act, a state that suspects a voter has moved cannot simply delete the record. It must mail a confirmation notice and, absent a response, hold the registration as inactive through two more federal general elections before removal. That waiting period is a federal requirement, not administrative neglect. States that mail ballots without a request send them to active registrations; inactive registrations do not generate an automatic ballot.
Nationally, for November 2024:
| Measure | 2024 total |
|---|---|
| Total registrations on the rolls | 234,504,358 |
| Active registrations | 211,144,275 |
| Inactive registrations | 23,184,185 (9.9% of the rolls) |
| Mail ballots transmitted to voters | 66,867,671 |
| Mail ballots returned by voters | 47,957,093 |
| Mail ballots returned as undeliverable | 932,533 (1.4% of transmitted) |
| Mail ballots never returned | 13,707,916 (20.5% of transmitted) |
| Confirmation notices sent (2022–24 cycle) | 39,670,903 |
| Registrations removed from the rolls (2022–24 cycle) | 21,298,175 |
Mail ballots transmitted equal about 28.5% of all registrations nationally. That average is close to meaningless, because it blends Oregon with Mississippi. The distribution is the story.
Mail ballots transmitted vs. registrations, by state (2024 general)
| State | Total reg. | Active | Inactive | Mail ballots transmitted | % of total reg. | Undeliv. |
|---|---|---|---|---|---|---|
| Oregon | 3,060,374 | 3,060,374 | — | 3,038,435 | 99.3% | 1.76% |
| Washington | 5,597,156 | 5,013,112 | 520,000 | 5,169,231 | 92.4% | 0.50% |
| Nevada | 2,256,275 | 2,052,976 | 202,810 | 2,069,339 | 91.7% | 3.24% |
| California | 25,720,597 | 22,836,602 | 2,883,995 | 23,003,434 | 89.4% | 1.54% |
| Colorado | 4,583,280 | 4,074,612 | 508,668 | 4,090,266 | 89.2% | 2.81% |
| Vermont | 500,986 | 460,415 | 40,571 | 441,666 | 88.2% | 4.80% |
| Hawaii | 861,333 | 765,998 | 95,335 | 755,841 | 87.8% | — |
| District of Columbia | 612,904 | 469,969 | 142,935 | 453,858 | 74.1% | 8.61% |
| Utah | 2,039,862 | 1,793,182 | 246,658 | 1,475,522 | 72.3% | 2.72% |
| Arizona | 5,075,337 | 4,366,786 | 708,551 | 3,582,082 | 70.6% | 1.98% |
| Montana | 800,573 | 691,534 | 107,822 | 503,295 | 62.9% | 2.32% |
| Indiana | 4,840,856 | 4,288,091 | 552,765 | 1,616,735 | 33.4% | 0.00% |
| Massachusetts | 5,142,343 | 4,369,280 | 773,063 | 1,349,590 | 26.2% | 0.73% |
| Michigan | 8,440,236 | 7,267,666 | 1,172,570 | 2,213,167 | 26.2% | 0.17% |
| Nebraska | 1,263,487 | 1,190,813 | 72,674 | 323,237 | 25.6% | 0.34% |
| Pennsylvania | 9,175,133 | 8,407,874 | 767,259 | 2,204,273 | 24.0% | 0.54% |
| South Dakota | 690,306 | 627,248 | 63,058 | 155,015 | 22.5% | 0.01% |
| Florida | 15,740,083 | 14,028,831 | 1,708,841 | 3,524,965 | 22.4% | 1.23% |
| Maryland | 4,555,217 | 4,231,112 | 320,634 | 878,815 | 19.3% | 0.23% |
| Maine | 1,223,468 | 1,041,826 | 181,642 | 224,646 | 18.4% | 0.09% |
| Idaho | 1,178,750 | 1,178,750 | — | 196,032 | 16.6% | 0.36% |
| New Jersey | 6,630,364 | 6,066,940 | 563,424 | 1,100,762 | 16.6% | — |
| Wisconsin | 3,933,068 | 3,933,068 | — | 614,367 | 15.6% | 0.45% |
| Minnesota | 3,853,668 | 3,853,668 | — | 576,563 | 15.0% | 0.82% |
| Ohio | 8,074,098 | 7,054,966 | 983,368 | 1,131,278 | 14.0% | 0.22% |
| Wyoming | 296,960 | 296,960 | — | 39,842 | 13.4% | 0.02% |
| Illinois | 8,970,541 | 8,104,485 | 817,109 | 1,177,760 | 13.1% | 0.60% |
| Iowa | 2,256,774 | 2,016,967 | 239,807 | 235,170 | 10.4% | — |
| Alaska | 611,078 | 565,242 | 45,836 | 60,695 | 9.9% | 1.46% |
| New Hampshire | 1,008,952 | 1,008,603 | — | 98,762 | 9.8% | 0.16% |
| New Mexico | 1,415,984 | 1,254,851 | 156,424 | 122,478 | 8.6% | — |
| Virginia | 6,380,686 | 5,898,922 | 481,764 | 531,154 | 8.3% | 1.00% |
| Kansas | 2,031,119 | 1,871,857 | 159,262 | 165,077 | 8.1% | 1.26% |
| New York | 13,579,416 | 12,429,981 | 1,149,435 | 975,377 | 7.2% | 1.38% |
| Rhode Island | 792,075 | 734,885 | 57,190 | 56,663 | 7.2% | 0.70% |
| North Carolina | 7,854,464 | 6,986,365 | 853,624 | 451,176 | 5.7% | 0.22% |
| Louisiana | 3,046,376 | 2,734,059 | 312,317 | 167,577 | 5.5% | 1.09% |
| Delaware | 788,441 | 742,370 | 46,071 | 40,728 | 5.2% | 1.12% |
| Connecticut | 2,520,650 | 2,292,818 | 227,832 | 129,996 | 5.2% | — |
| Oklahoma | 2,442,211 | 2,095,952 | 346,259 | 124,664 | 5.1% | 0.49% |
| Missouri | 4,388,787 | 4,075,977 | 312,810 | 199,327 | 4.5% | 0.36% |
| Georgia | 8,234,335 | 7,174,961 | 1,059,374 | 327,241 | 4.0% | 0.70% |
| Kentucky | 3,548,136 | 3,219,361 | 328,775 | 131,762 | 3.7% | 0.05% |
| Alabama | 3,868,040 | 3,466,606 | 401,434 | 140,558 | 3.6% | — |
| South Carolina | 3,851,187 | 3,417,493 | 433,694 | 108,922 | 2.8% | — |
| Texas | 18,623,931 | 16,611,078 | 2,012,853 | 463,200 | 2.5% | 0.45% |
| West Virginia | 1,210,415 | 1,118,468 | 91,947 | 24,830 | 2.1% | 0.44% |
| Tennessee | 4,825,601 | 4,458,851 | 366,750 | 98,452 | 2.0% | 0.39% |
| Arkansas | 1,835,723 | 1,359,659 | 476,064 | 29,173 | 1.6% | 0.25% |
| Mississippi | 2,131,726 | 1,965,948 | 165,778 | 28,558 | 1.3% | — |
| North Dakota | n/a | n/a | n/a | 94,676 | n/a | 0.00% |
Source: NexfinityNews analysis of the U.S. Election Assistance Commission 2024 EAVS public-release file (fields A1a, A1b, A1c, C1a, C1c), aggregated from 6,461 jurisdictions. Dashes indicate the state did not report that field. North Dakota has no voter registration.
What the distribution shows
The comparison only bites in nine jurisdictions. Eight states — California, Colorado, Hawaii, Nevada, Oregon, Utah, Vermont and Washington — plus the District of Columbia mail a ballot to every active registered voter without a request. Those nine produced 40.5 million of the 66.9 million mail ballots transmitted nationally, 61% of the total, while holding 19% of the country’s registrations. Everywhere else, a voter has to ask. Utah is the exception in motion: under a 2025 law it shifts to opt-in mail voting in 2029, but for 2026 it still mails automatically.
Oregon’s 99.3% ratio describes the policy, not a defect in it. Oregon reports no inactive category, so numerator and denominator cover nearly the same population.
Four states transmitted more ballots than they had active registrations: Washington (103.1%), Nevada (100.8%), California (100.7%) and Colorado (100.4%). This is a counting artifact, not a surplus of ballots in circulation. The EAC’s transmitted field includes replacement ballots — a voter who loses one and requests another generates a second transmission — and registrations continue accruing through the mailing window in same-day-registration states. It is the kind of artifact that gets screenshotted without its footnote.
The largest rolls are in the states that mail the fewest ballots. Texas carries 18.6 million registrations, 2.0 million inactive, and mailed 463,200 ballots. New York carries 13.6 million and mailed 975,377. Arkansas has the highest inactive share in the country, 25.9%, and transmitted 29,173 mail ballots. In those states an unpurged registration is a line in a database. It does not produce an envelope.
Undeliverability is where roll quality actually surfaces. Nationally 932,533 transmitted ballots came back undeliverable, 1.4%; in the universal-mail states, 1.77%. The outliers are stark: the District of Columbia at 8.61%, Vermont at 4.80%, Nevada at 3.24%, Colorado at 2.81%. At the other end, Indiana reported 0.00% and South Dakota 0.01% — low enough to suggest non-reporting rather than perfection.
The biggest category is neither. Some 13.7 million transmitted ballots, 20.5%, were simply never returned — 27.3% in the universal-mail states, 55.9% in Nevada. An unreturned ballot is usually a voter who chose to vote in person or not at all. It is not a missing ballot. But it is 13.7 million pieces of live election mail in the world, which is the fact both sides of this argument are reacting to.
What audits the roll instead
The instrument that evaluates registrations already exists and is unglamorous: the NVRA confirmation-notice cycle. It produced 39.7 million notices between the 2022 and 2024 general elections and 21.3 million removals, including 6.5 million for moves and 4.5 million for death. It runs on death records, change-of-address data and cross-state matching, and it runs slowly by design.
USPS has said it would not compare portal data against state voter rolls or independently determine whether anyone on a list is eligible. The rule takes the state’s list as given.
Two other federal efforts do aim at the rolls, and both are legally distinct from the postal rule. Executive Order 14399 directs the Department of Homeland Security to build state-specific lists of citizens it believes are eligible to vote — a provision still in effect and untouched by the Aug. 27 restraining order. Separately, the Justice Department has demanded full statewide voter files from nearly every state, has sued 30 states and the District of Columbia to obtain them, and has told a court it intends to run those files against DHS’s SAVE database. Courts have dismissed several of those suits; at least a dozen states complied voluntarily.
These three efforts are routinely discussed as one policy. They are not.
Where the litigation stands
The sequence inside one week: On Aug. 24 the Supreme Court lifted an injunction covering 23 states and D.C., holding the challenge premature because the rule was still only proposed. On Aug. 26 Judge Talwani vacated her own nationwide injunction, writing that she felt compelled by that reasoning while noting the challengers had substantial arguments. On Aug. 27, with the rule now final and the ripeness objection gone, she issued a temporary restraining order blocking its core provisions.
Talwani found the plaintiffs likely to succeed on claims that USPS lacked statutory authority to issue the rule, that it unconstitutionally imposes requirements on states, and that it unconstitutionally bars noncompliant officials from using the mail to send ballots. She wrote that most plaintiff states have already ordered their ballots and that some must begin mailing within days, and that the record continues to lack evidence of fraudulent mail voting. The order runs 14 days. A hearing on a longer injunction is set for Sept. 3.
Impact: what it costs and who absorbs it
Ballot envelope design is a technical specification, not a graphic choice. Tammy Patrick of The Election Center, who helped develop the original ballot-tracking barcode system with USPS, has said the executive order applies those tools without funding or an implementation path, and that even a change in how a ballot folds can affect whether it tabulates correctly. She has noted that more than a third of election offices lack a full-time employee, and that some lack a dedicated computer (Votebeat).
Cost estimates in the rulemaking record put new envelopes for a jurisdiction of roughly 2,500 voters at about $10,000, before the cost of learning new systems (Votebeat).
It is also worth naming what the portal is in data terms: a federal database mapping named individuals to home addresses to two unique tracking identifiers, retained by a federal agency and explicitly framed as useful to federal law enforcement. Whatever one concludes about the election-integrity case, it is a new government dataset created by rule rather than by statute. Readers following our reporting on the absence of a constitutional privacy right will recognize the structure.
Analysis
Three distinct premises are being argued as though they were one.
The first is that mail ballots move through a system nobody can see. That is largely true, and tracking is the answer — which is why states adopted it voluntarily years before any executive order.
The second is that bloated rolls push unrequested ballots to stale addresses. The 2024 data supports a narrow version and not the broad one. The 42 states where a ballot must be requested send almost nothing to an unmaintained address. In the nine universal-mail jurisdictions, ballots go only to active registrations, and the measurable failure rate ran between 0.50% and 8.61%, with D.C. and Vermont as outliers deserving their own reporting.
The third premise has the best evidence behind it and the least airtime. After Watson, the postmark decides whether a late-arriving ballot counts in about 30 states, and the postmark is deteriorating. A scan timestamp is a better instrument for that question. It is available to the administration as a defense of the rule and it is not the defense being offered — the rule is justified in the language of fraud and law enforcement access, and the provisions now enjoined are the enrollment portal and the gatekeeping authority, not the barcode.
A perfectly implemented barcode system would have told us where all 66,867,671 of the 2024 mail ballots went, and when roughly 33 million of them entered the mail. It would not have told us whether any of them should have been printed. Both are worth knowing. Only one is what this rule is fighting about.
Conclusion
The Sept. 3 hearing will determine whether any of the rule applies to the November midterms. However it resolves, the underlying situation persists: the Supreme Court has made the timing of a voter’s act legally decisive in about thirty states, and the evidence of that timing is a mark the Postal Service applies inconsistently and sometimes not at all. That problem does not disappear if this rule is struck down, and none of the three federal efforts now in litigation was designed to solve it.
The federal data describing all of it is published every two years, is free, and is not in dispute. Very little of the argument is being conducted on it.
NexfinityNews has sought comment from the U.S. Postal Service, the Election Assistance Commission, the National Association of Secretaries of State and the Voting Rights Lab. This piece will be updated with responses and with the outcome of the Sept. 3 hearing.
Key Takeaways
- Watson v. RNC (June 29, 2026) upheld mail-ballot grace periods 5-4, leaving the postmark as the deciding evidence for late-arriving ballots in 14 states plus D.C. for all mail ballots and 16 more states for military and overseas voters.
- The postmark is unreliable by design — a byproduct of mail processing. The USPS Inspector General has documented envelopes sticking together and prepaid reply envelopes going uncancelled. 103,441 mail ballots were rejected as late in 2024.
- The USPS rule finalized Aug. 21 and published Aug. 26 would produce a machine-readable timestamp for every federal ballot envelope — the most direct answer available to the problem Watson left behind. It is not being defended on those grounds. The rule was proposed June 2, four weeks before the decision.
- Three limits: a scan proves a ballot was mailed by a moment, not after one; 31.1% of returned ballots came back through drop boxes and generate no postal scan; and state grace-period statutes are written around postmarks, not tracking events.
- The tracking function is severable from the contested machinery. Serialized barcodes and Informed Visibility already exist and states already use them. What the rule adds is the mandatory portal, the enrollment list, and USPS authority to refuse a state’s ballot mailing.
- On the separate roll question: 66,867,671 mail ballots were transmitted in 2024 against 234,504,358 registrations, 211,144,275 of them active. Nine universal-mail jurisdictions produced 61% of mail ballots while holding 19% of registrations. 932,533 ballots (1.4%) came back undeliverable.
- 23.2 million registrations (9.9%) were inactive. Inactive registrations do not automatically receive a ballot; NVRA requires holding them through two federal general elections before removal.
- Judge Talwani’s Aug. 27 restraining order runs 14 days; a hearing on a preliminary injunction is set for Sept. 3. The DHS citizenship-list provision remains in effect.
Sources
- Watson v. Republican National Committee, U.S. Supreme Court, decided June 29, 2026 — SCOTUSblog
- USPS, “Ballot Mail for Federal Elections,” final rule, Federal Register, Aug. 26, 2026
- USPS, Kit 600: 2026-2027 Official Election Mail
- U.S. Election Assistance Commission, 2024 EAVS report and public-release data file
- EAC press release on the 2024 EAVS, June 30, 2025
- Voting Rights Lab, Supreme Court upholds ballot postmark grace period laws
- Votebeat, Supreme Court allows states to accept mail ballots that arrive after Election Day
- Brennan Center, What if Mail Ballots Arrive After Election Day Without a Postmark?
- Brennan Center, Tracker of Justice Department Requests for Voter Information
- Brookings, Delivering the vote: How 4 pressures are testing the Postal Service’s role in American elections
- NBC News, Judge blocks Trump’s Postal Service regulation on mail-in ballots, Aug. 27, 2026
- Axios, Judge lifts nationwide block on Trump mail-in voting executive order
- CNN, Supreme Court backs Trump’s order to curb mail ballots
- Votebeat, USPS mail ballot proposal could add new hurdles for voters and election officials
- Biometric Update, USPS finalizes mail-in voter ballot rule that would give law enforcement voter-linked data
- CNN, Postmarks come under scrutiny as states prepare for mail-in voting, Aug. 11, 2020
- National Voter Registration Act of 1993, 52 U.S.C. §20507