
Intro
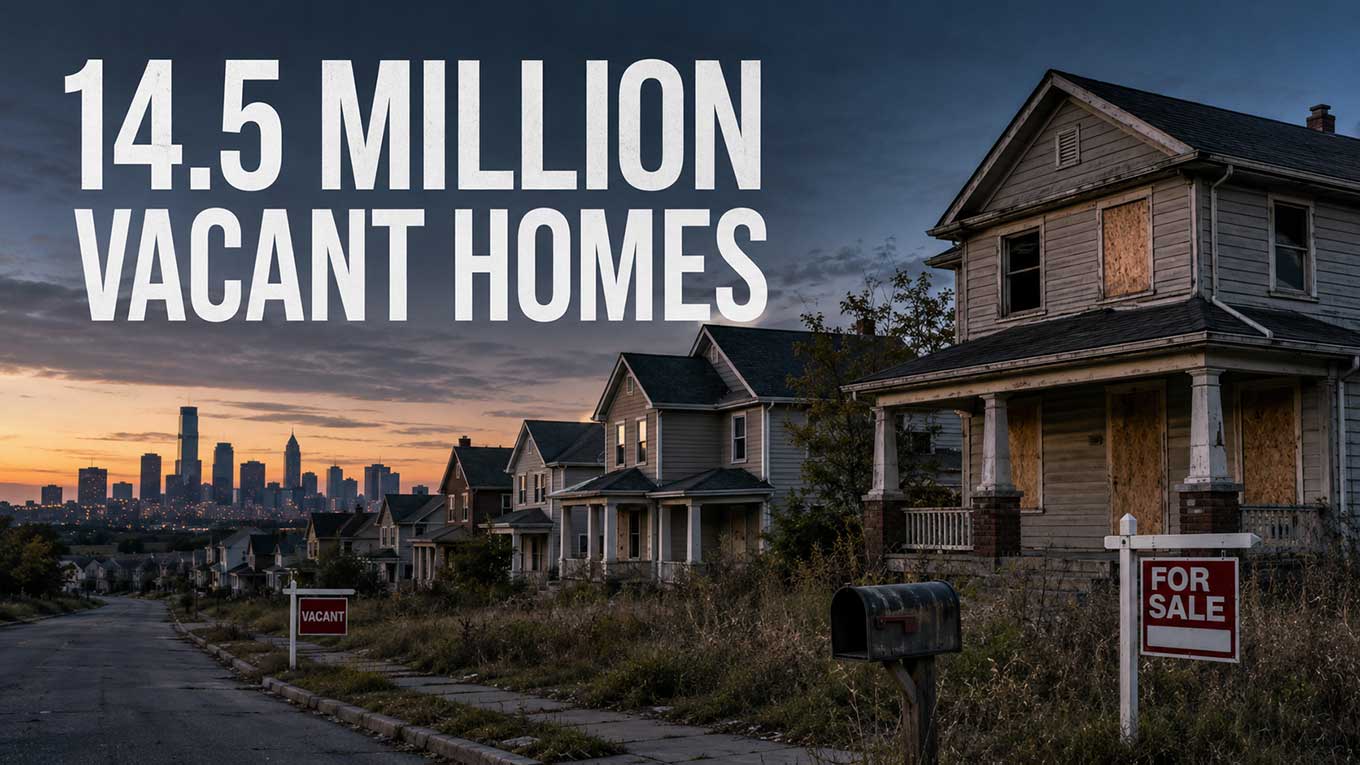
LendingTree released a national housing vacancy study on July 7, 2026, finding that roughly 14.5 million U.S. homes — about one in ten housing units — sit vacant. Florida alone accounts for approximately 1.5 million of them, nearly as many as the other nine states in the top-ten vacancy ranking combined.
The headline number arrived at a moment when federal economists have estimated the country needs some 10 million additional housing units to close the gap between supply and demand. The apparent contradiction drove much of the coverage that followed.
The study’s own conclusion is narrower than the headline suggests. Of those 14.5 million vacant units, fewer than 800,000 — about 5.5 percent — were listed for sale.
Background
The analysis was authored by Matt Schulz, LendingTree’s chief consumer finance analyst, and drew on the U.S. Census Bureau’s 2024 American Community Survey five-year estimates. It was released July 7 and picked up broadly across trade and general-interest outlets in the two weeks that followed.
The national vacancy rate stood at 10.1 percent in 2024, down from 10.4 percent in 2023. That 0.31-percentage-point decline translates to roughly 302,000 fewer vacant homes year over year. The longer trend runs the same direction: the vacancy rate has fallen from 12.5 percent in 2014.
LendingTree characterizes a vacancy rate between 7 and 8 percent as consistent with a balanced market — enough slack for buyers and renters to have options without signaling oversupply.
How the Census Counts a Vacant Home
The gap between “vacant” and “available” is a definitional one, and it drives nearly every finding in the report.
The Census Bureau classifies a housing unit as vacant when it is habitable but is not someone’s primary residence. That definition captures a wide range of properties that have nothing to do with an empty house waiting for a buyer.
In simple terms: a ski condo in Vermont that its owner uses six weekends a year is counted as vacant, and so is an apartment that sits empty for three weeks between tenants.
The report breaks the 14.5 million into Census subcategories:
- 35.9 percent — “Other vacant.” The largest single category. A catch-all covering foreclosures, probate and estate properties, homes tied up in legal proceedings, units needing repair, and properties owners are holding off the market.
- 32.6 percent (4.7 million) — Seasonal, recreational or occasional use. Vacation homes, beach cottages, hunting cabins, timeshares.
- 18.2 percent (2.6 million) — For rent. Normal turnover in a functioning rental market.
- 5.5 percent (under 800,000) — For sale. The inventory actually on the market.
The remainder covers units sold or rented but not yet occupied, plus a small migrant-worker housing category.
Examples: Where the Numbers Diverge
Maine posted the nation’s highest vacancy rate at 20.6 percent, or about 154,717 vacant homes. Vermont followed at 19.4 percent and Alaska at 17.6 percent.
Vermont illustrates the definitional problem most sharply: 75.8 percent of its vacant homes are seasonal or recreational, the highest share in the country. That works out to roughly one in seven homes statewide sitting empty during the offseason — concentrated in Stowe, Killington and the Lake Champlain corridor. Those properties are generally well maintained and high-value, and they contribute nothing to year-round supply.
Florida carries the 1.5 million figure that has circulated in isolation. Its vacancy rate of 14.7 percent ranks fifth nationally, but the state’s housing stock is large enough that the raw count dwarfs everyone else in the top ten.
California and Texas each have roughly 1.1 million vacant homes while ranking in the bottom half of states by rate — California’s 7.5 percent is among the lowest in the nation. Sheer inventory size, not looseness in the market, produces the count.
Mississippi leads in the “other vacant” share at 62.5 percent, a very different profile from Vermont’s seasonal skew and one that points more toward distress, disrepair and legal encumbrance.
At the low end: Connecticut at 7.0 percent, Washington at 7.3 percent, and a three-way tie among California, New Jersey and Oregon at 7.5 percent.
Historical Norms: Where the Last Decade Sits
The LendingTree study captures a single year. Placed against the past ten, the more useful finding is that the three vacancy measures the Census Bureau publishes have moved in different directions — and only one of them has loosened.
In simple terms: one number counts every empty unit, one counts empty rentals, and one counts empty homes listed for sale. They are not interchangeable, and the coverage has mostly conflated them.
Gross vacancy: a decade of steady decline
The measure LendingTree used — all vacant units as a share of total housing stock — has fallen consistently. The American Community Survey put it at 12.5 percent in 2014, 10.4 percent in 2023, and 10.1 percent in 2024. That is a decline of roughly 2.4 percentage points across the decade, with no sustained reversal.
The Census Bureau’s separate quarterly Housing Vacancy Survey, which uses a different methodology and a smaller sample, showed gross vacancy at 10.3 percent in the first quarter of 2026 and 10.5 percent in the second — broadly consistent with the ACS reading and essentially flat over the past year.
Rental vacancy: back inside the balanced range
The rental vacancy rate is the one measure that has meaningfully loosened, and the shift is recent.
| Period | Rental vacancy rate |
| Q4 2020 | 6.5% |
| Q4 2021 | 5.6% |
| Q4 2022 | 5.8% |
| Q4 2023 | 6.6% |
| Q4 2024 | 6.9% |
| Q4 2025 | 7.2%* |
| Q1 2026 | 7.3% |
| Q2 2026 | 7.3% |
Source: U.S. Census Bureau, Current Population Survey/Housing Vacancy Survey. *The fourth-quarter 2025 estimate is based only on November and December data; a lapse in federal funding halted collection in October 2025.
The 2022 annual rate of 5.8 percent was a 38-year low. Since then the rate has climbed roughly 1.5 percentage points, driven largely by multifamily construction completions reaching the market. At 7.3 percent, it now sits inside the 7-to-8-percent band LendingTree identifies as consistent with a balanced market — the first time it has done so in several years.
For long-run scale: the rental vacancy rate peaked at 11.1 percent in the third quarter of 2009, during the foreclosure crisis, and hit a record low of 5.0 percent in 1978.
Homeowner vacancy: still near the historical floor
This is the measure closest to the question buyers are actually asking, because it counts the share of the owner-occupied inventory sitting vacant and listed for sale.
| Quarter | Homeowner vacancy rate |
| Q1 2020 | 1.1% |
| Q1 2021 | 0.9% |
| Q1 2022 | 0.8% |
| Q2 2023 | 0.7% |
| Q4 2024 | 1.1% |
| Q4 2025 | 1.2%* |
| Q1 2026 | 1.1% |
| Q2 2026 | 1.2% |
Source: U.S. Census Bureau, CPS/HVS. *Same fourth-quarter 2025 collection caveat applies.
The 0.8 percent reading in the first quarter of 2022 was the lowest in the 66-year history of the survey. The rate went lower still in 2023, touching 0.7 percent.
The recovery since then is real but small in absolute terms. The Census Bureau has noted that the homeowner vacancy rate did not fall below 1.0 percent at any point in the four decades between 1980 and the start of the pandemic. Today’s 1.2 percent therefore sits at the bottom edge of the range that prevailed for a generation — not above it.
By comparison, the rate reached 2.9 percent in 2008, at the peak of the foreclosure inventory.
The demand-side counterpart
The homeownership rate bottomed at 62.9 percent in the second quarter of 2016, the low point of the post-crisis cycle. It stood at 65.0 percent in the second quarter of 2026 — higher than a decade ago, and roughly flat over the past two years, with the Census Bureau reporting no statistically significant change from the same quarter in 2025.
Impact on Prices
The report’s most direct pricing finding is a correlation, not a causal claim. Across the states with the lowest vacancy rates, median home values average $435,118 — roughly $167,700 higher than the average across the states with the highest vacancy rates.
Schulz frames the mechanism in terms of competition rather than raw supply: falling vacancy generally indicates that available homes are being absorbed faster than new inventory arrives, which leaves buyers and renters with fewer choices and less leverage on price.
There are exceptions that cut against a simple reading. New Hampshire, Alaska and Florida all carry above-median home values alongside high vacancy rates — again a function of seasonal stock inflating the vacancy count in markets that are otherwise tight for year-round residents.
The near-term implication for prices is that the 14.5 million figure should not be read as latent supply. The roughly 800,000 units listed for sale represent the inventory buyers are actually competing over, and that pool has been picked over. The 302,000-unit decline in vacancies over one year occurred while mortgage rates were elevated — a period in which turnover would ordinarily be expected to slow.
In simple terms: empty houses are not the same thing as houses you can buy, and the number that matters for what you pay is the second one.
The decade series sharpens that point. Renters have gained something measurable over the past three years: roughly 1.5 percentage points of additional vacancy, which is the mechanism behind the flattening rent growth reported in many metros. Buyers have not. The homeowner vacancy rate has recovered from a record floor to a level still at the bottom of its 40-year range, and the gross vacancy rate has continued to decline.
That divergence is the most direct answer to what the 14.5 million figure means for home prices: the loosening is happening in the rental stock, not the for-sale stock.
Analysis
Four tensions in the data are worth watching.
First, the “other vacant” category is doing an enormous amount of work. At 35.9 percent, it is the largest bucket in the study, and it aggregates conditions with opposite implications — a foreclosure that will eventually reach market and a second home an owner declines to sell because it carries a locked-in low mortgage rate are counted identically. How much of that 5.2 million is genuinely retrievable supply is not answerable from the ACS data alone.
Second, the rate-lock effect is embedded in the count. Owners holding properties off the market rather than trading a below-market mortgage for a higher one add to vacancy while subtracting from available inventory. That is a policy-sensitive number, and it moves with rates rather than with construction.
Third, the seasonal share is a distributional question, not a supply question. In Vermont, Maine and New Hampshire, roughly seven in ten vacant homes are seasonal or recreational. Where that concentration exists, local affordability pressure is a function of who owns the stock, not how much of it exists — a question that falls to state and municipal policy rather than national housing production targets.
Fourth, the two survey series can disagree, and the comparison window matters. The ACS five-year estimates LendingTree used smooth data across a rolling period and lag the current market; the quarterly HVS is timelier but carries wider margins of error and had its October 2025 collection interrupted by a federal funding lapse. Coverage that pairs a 2024 ACS figure with a 2026 quarterly figure without noting the difference produces a comparison the underlying data does not support.
Readers should also note the source’s commercial position. LendingTree is a mortgage marketing lead generator, and its research operation produces content that supports that business. The underlying data is federal and publicly available; the framing is the company’s.
Conclusion
The July 7 study is best read as a correction to a recurring misreading rather than as news of a hidden housing surplus. The 14.5 million figure is real, the 1.5 million Florida figure is real, and neither describes homes a buyer can go out and purchase.
For price direction, the operative numbers are the falling national vacancy rate, the sub-800,000 for-sale count, and the 7-to-8-percent threshold LendingTree identifies as balanced — a level most high-demand states now sit below.
Key Takeaways
- LendingTree published the study on July 7, 2026, based on Census Bureau 2024 American Community Survey five-year estimates.
- 14.5 million U.S. homes are vacant — about one in ten housing units, a 10.1 percent national rate.
- The widely circulated 1.5 million figure refers to Florida, not the nation.
- Fewer than 800,000 vacant homes (5.5 percent) are listed for sale.
- Vacancies fell by roughly 302,000 units between 2023 and 2024, and the national rate is down from 12.5 percent in 2014.
- Over the past decade, the rental vacancy rate fell to a 38-year low of 5.8 percent in 2022, then rose to 7.3 percent by mid-2026 — back inside the 7-to-8-percent balanced range.
- The homeowner vacancy rate hit a record 0.8 percent in early 2022, the lowest in the survey’s 66-year history, and has recovered only to 1.2 percent — still at the bottom of the range that held from 1980 to 2020.
- States with the lowest vacancy rates carry median home values averaging about $167,700 higher than states with the highest.
- The loosening of the past three years is concentrated in rentals, not for-sale housing — which is why the headline vacancy number has not translated into price relief for buyers.
Sources
- LendingTree, “14.5 Million US Homes Are Vacant — Here Are the States With the Highest Vacancy Rates,” July 7, 2026 — lendingtree.com/home/mortgage/vacancy-rates-study/
- U.S. Census Bureau, 2024 American Community Survey, five-year estimates
- U.S. Census Bureau, “Quarterly Residential Vacancies and Homeownership, First Quarter 2026,” Release CB26-62, April 28, 2026
- U.S. Census Bureau, “Quarterly Residential Vacancies and Homeownership, Second Quarter 2026,” July 28, 2026
- U.S. Census Bureau, “Homeowner and Rental Vacancy Rates Declined During COVID-19 Pandemic,” Census Bureau Library, 2022
- U.S. Census Bureau, “Homeowner and Rental Vacancies in the American Community Survey: 2008-2024,” ACS-64, May 2026
- Newsweek, “Map Shows States With Highest and Lowest Number of Empty Homes”
- The MortgagePoint, “There Are 14.5M U.S. Homes Sitting Vacant (But How Many Are Actually for Sale?),” July 7, 2026
- Scotsman Guide, “About 1 in 10 U.S. Homes Sit Vacant: LendingTree”
- Mortgage Professional America, “What the 14.5 Million Vacant Homes Figure Actually Means for Your Buyers”
- The Boston Globe, “High Vacancy Rates Cloud Housing Shortage, Especially in New England’s Vacation Destinations,” July 21, 2026
- Quartz, “The 5 U.S. States With the Highest Housing Vacancy Rates in 2026”