
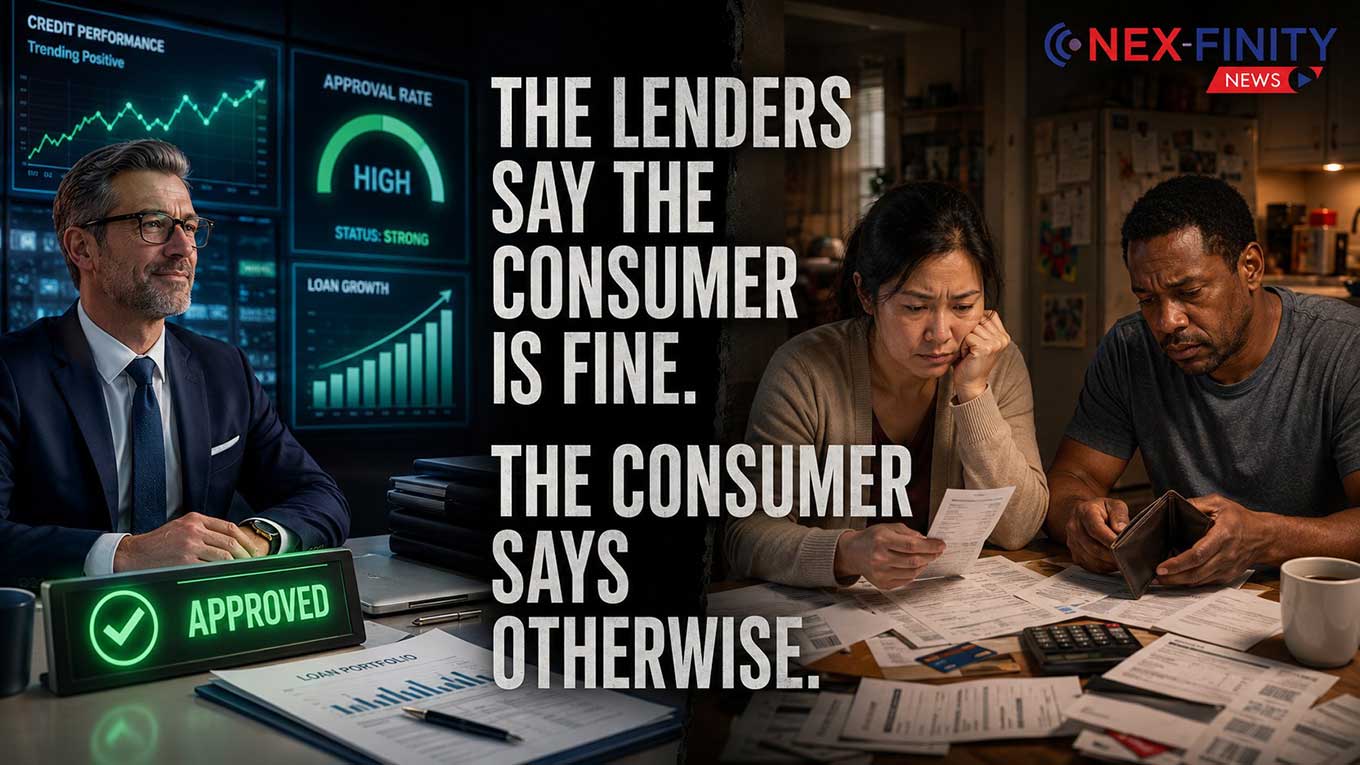
Five of the largest credit card lenders in the United States told investors this summer that American consumers are paying their bills better than expected. Three of them lowered their forecasts for how much money they expect to lose to defaults this year.
In the same weeks, consumer sentiment fell to a level below the 1st percentile of the University of Michigan’s entire survey history.
Both measurements appear to be accurate. Understanding why requires separating two questions that most coverage of the American consumer treats as one: whether households can pay their debts, and whether households can afford their lives.
Background
The second quarter of 2026 produced an unusually consistent set of results across the card industry.
American Express reported a 30-day delinquency rate of 1.2 percent, down from 1.3 percent across the prior four quarters, with net write-offs flat at 2.0 percent. The company released $191 million in loan loss reserves and raised its full-year revenue growth guidance.
Capital One released $662 million and reported a domestic card charge-off rate of 4.71 percent, down 39 basis points from the prior quarter. Its 30-plus-day delinquency rate fell 19 basis points year over year to 3.13 percent. Chief Executive Richard Fairbank told analysts on the July earnings call that credit was continuing to come in strong, and that in nearly every month of 2026, delinquencies had moved slightly better than the company’s own seasonal projections.
Synchrony Financial reported a net charge-off rate of 5.43 percent, down 27 basis points from a year earlier, and cut its full-year loss guidance. Bread Financial reported a net principal loss rate of 6.98 percent, down from 7.88 percent, and improved its full-year outlook to a range of 7.0 to 7.1 percent from a prior 7.2 to 7.4 percent. JPMorgan Chase told investors it expects its Card Services net charge-off rate to run near 3.2 percent for the full year, better than it had previously anticipated.
| Issuer | Q2 2026 credit metric | Direction | 2026 guidance move |
| American Express | 1.2% delinquency; 2.0% net write-off | Improving | $191M reserve release |
| Capital One | 4.71% domestic card charge-off, −39 bps QoQ | Improving | $662M reserve release |
| Synchrony Financial | 5.43% net charge-off; 4.16% 30+ day delinquency | Improving | Loss guidance cut to under 5.5% |
| Bread Financial | 6.98% net principal loss, from 7.88% | Improving | Loss guidance cut to 7.0–7.1% |
| JPMorgan Chase (Card) | Improving | ~3.2% full-year net charge-off |
That list spans the entire American credit spectrum. American Express and JPMorgan lend primarily to high-income borrowers. Synchrony and Bread issue retail partner cards to the lowest-scoring consumers of any publicly traded issuer in the group.
How Lenders Report Credit
Three terms carry most of the weight in these disclosures.
A delinquency rate measures the share of balances past due at a point in time. A net charge-off rate measures balances the lender has given up on collecting, typically at 180 days past due. A reserve release occurs when a lender reduces the pool of money it has set aside against expected future losses.
In simple terms: delinquency and charge-offs describe what already happened. A reserve release describes what management expects to happen next.
That distinction matters for how much weight the industry’s summer results should carry. Under the accounting standard governing loan loss reserves, a release reflects a company’s own forecast of future credit performance. It is evidence of what lenders believe. It is not, on its own, evidence that the belief is correct.
The Historical Picture
The individual company results are consistent with the broader federal data, and both look better against long-run history than recent coverage suggests.
| Measure | Current | Financial-crisis peak | Long-run reference |
| Card delinquency (Federal Reserve) | 3.03% (Q4 2025) | 6.61% (Q1 2009) | 4.5%–5% through most of the 1990s |
| Card charge-offs (Federal Reserve) | 4.11% (Q4 2025) | 10.54% (Oct. 2009) | ~3.7% pre-pandemic |
| Mortgage delinquency (MBA) | 4.37% (Q2 2026) | 10.06% (Q1 2010) | 5.36% average, 1979–present |
| Foreclosure inventory (MBA) | 0.67% | ~4.6% (Q4 2010) | ~1.2% |
| Household debt service ratio | 11.16% (Q1 2026) | 15.85% (Q4 2007) | Above 14% throughout 2005–2008 |
The Federal Reserve’s card delinquency series is the most striking entry. At roughly 3 percent, the current rate is lower than any reading recorded between 1991 and 2007. The only period that makes today look elevated is the 2014-to-2019 window, which followed the most significant tightening of consumer credit rules in modern American history.
The Mortgage Bankers Association has placed its own long-run average delinquency rate at 5.36 percent, measured from 1979. The current 4.37 percent sits below it.
The household debt service ratio may be the most important number of the set. Americans carry a record $18.8 trillion in household debt, but required debt payments consume 11.16 percent of disposable income, against 15.85 percent at the 2007 peak. The stock of debt is at a record. The burden of servicing it is not.
A Widely Reported Figure That Requires Context
One statistic drove a substantial share of this summer’s coverage: the share of credit card balances 90 or more days delinquent, which rose from 7.6 percent in the third quarter of 2022 to 12.8 percent in the first quarter of 2026. Several outlets presented it as evidence that Americans are falling behind at rates not seen since the Great Recession.
The Federal Reserve Bank of New York, which publishes the figure, has said that reading is incorrect. In an August analysis accompanying its quarterly household debt report, bank researchers attributed the increase to charged-off debts that lenders now report to credit bureaus for far longer than they once did. Between 2004 and 2012, roughly 40 percent of charged-off debts were still being reported one year later. By 2024, that figure had doubled to 80 percent.
Removing those balances brings the measure back in line with the rate of new delinquencies, which the New York Fed describes as relatively stable for nearly two years. Bank researchers told reporters on the August 11 press call that the 12.8 percent figure is a lagging indicator reflecting old charge-offs.
Analysis
Three qualifications belong alongside the industry’s results.
Improving loss rates partly reflect who was removed from the loan book
Bread Financial attributed its improvement in part to the maturation of higher-quality new account acquisitions. Capital One disclosed that its Discover card portfolio is in what Fairbank described as a temporary contraction, with balances down 1.5 percent year over year following earlier pullbacks in credit expansion. Loss rates decline when lenders stop extending credit to borrowers likely to default. “Credit performance is improving” and “lenders tightened aggressively in 2024 and 2025” are the same event described from opposite ends.
The Federal Reserve’s July Senior Loan Officer Opinion Survey, released August 3, supports that reading. A modest net share of banks reported tightening credit card standards during the second quarter, and the survey found consumer loan standards at the tighter end of their historical ranges, with subprime card standards especially tight.
Absolute levels remain high even where direction is favorable
Bread Financial expects to lose roughly 7 percent of its loan book this year. Synchrony’s charge-off rate exceeds 5 percent. Those are meaningful losses regardless of the trend.
Every outlook rests on stated assumptions
Synchrony’s guidance explicitly assumes no significant change in inflation rates and a stable macroeconomic environment. Bread’s assumes continued consumer resilience and a generally stable labor market. Both were issued in July.
Impact
The reconciliation between lender data and consumer sentiment is less mysterious than it appears.
Credit performance measures whether households can service debt. Sentiment measures whether households can afford their standard of living. A consumer who once paid a card balance in full each month and now makes minimum payments appears nowhere in delinquency data. Neither does a household that cut spending to stay current, or one whose grocery costs rose faster than its wages.
The University of Michigan’s August survey captures that distinction directly. Only 8 percent of consumers expect their income growth to exceed inflation over the coming year, down from 18 percent in December 2024. The steepest declines came among older consumers, lower-income consumers, and those without a college degree the groups most exposed to erosion of purchasing power.
Survey director Joanne Hsu noted that views of personal finances declined only slightly in August, while expectations for business conditions fell 11 percent for the short run and 17 percent for the long run. Sentiment fell across the political spectrum, with the sharpest month-over-month drop among Republicans, whose readings now sit 19 percent below levels recorded before the Iran conflict.
In simple terms: the data measuring debt repayment and the data measuring economic mood are not in conflict. They are answering different questions.
Conclusion
The credit card industry’s second-quarter results establish something narrower than either an all-clear or a warning. They establish that as of July, five lenders holding several hundred billion dollars in consumer receivables including the two most exposed to subprime borrowers expected fewer losses than they had previously forecast.
Those forecasts were built on assumptions about inflation and the labor market that the August sentiment data suggests consumers no longer share. Year-ahead inflation expectations reached 4.3 percent in Michigan’s preliminary August reading, above every figure recorded in 2024.
The test arrives in October, when third-quarter results are reported. If Synchrony and Bread hold their loss guidance through an energy price shock, the resilience case is confirmed on the evidence that matters most. If they revise, the first evidence will appear in exactly the portfolios where it would be expected to appear first.
Until then, the accurate description of the American consumer is not that reports of distress are wrong. It is that distress is showing up in purchasing power rather than in defaults, and the datasets most often cited in economic coverage are not designed to measure the former.
Key Takeaways
- American Express, Capital One, Synchrony, Bread Financial and JPMorgan Chase all reported improving credit performance in the second quarter of 2026. Synchrony, Bread and JPMorgan lowered their full-year loss expectations.
- Credit card delinquency at commercial banks is lower than any level recorded between 1991 and 2007. Mortgage delinquency sits below its 1979-to-present average.
- Household debt is at a record $18.8 trillion, but debt service consumes 11.16 percent of disposable income, against 15.85 percent at the 2007 peak.
- A widely cited figure showing 12.8 percent of card balances 90 days delinquent reflects extended reporting of old charge-offs, according to the Federal Reserve Bank of New York, not a rise in new delinquencies.
- Improving loss rates partly reflect credit tightening that removed higher-risk borrowers from lending portfolios.
- Consumer sentiment sits below the 1st percentile of its historical range. Only 8 percent of consumers expect income growth to outpace inflation this year.
Sources
- Federal Reserve Bank of New York, Quarterly Report on Household Debt and Credit, Q2 2026 newyorkfed.org
- Federal Reserve Bank of New York, Liberty Street Economics, How Distressed Are Consumers? Reconciling Diverging Credit Card Delinquency Measures libertystreeteconomics.newyorkfed.org
- Board of Governors of the Federal Reserve System, July 2026 Senior Loan Officer Opinion Survey federalreserve.gov
- Federal Reserve, Charge-Off and Delinquency Rates on Loans and Leases at Commercial Banks series DRCCLACBN and CORCCACBS
- Federal Reserve, Household Debt Service Payments as a Percent of Disposable Personal Income series TDSP
- Mortgage Bankers Association, National Delinquency Survey, Q2 2026 mba.org
- University of Michigan Surveys of Consumers, preliminary August 2026 release sca.isr.umich.edu
- American Express Company, Q2 2026 earnings release americanexpress.com investor relations
- Capital One Financial Corporation, Q2 2026 earnings presentation investor.capitalone.com
- Synchrony Financial, Q2 2026 earnings release and outlook (July 21, 2026) URL to be confirmed from investor relations
- Bread Financial Holdings, Q2 2026 earnings release and outlook (July 2026) URL to be confirmed from investor relations
- JPMorgan Chase & Co., Q2 2026 earnings presentation (July 14, 2026) URL to be confirmed from investor relations