
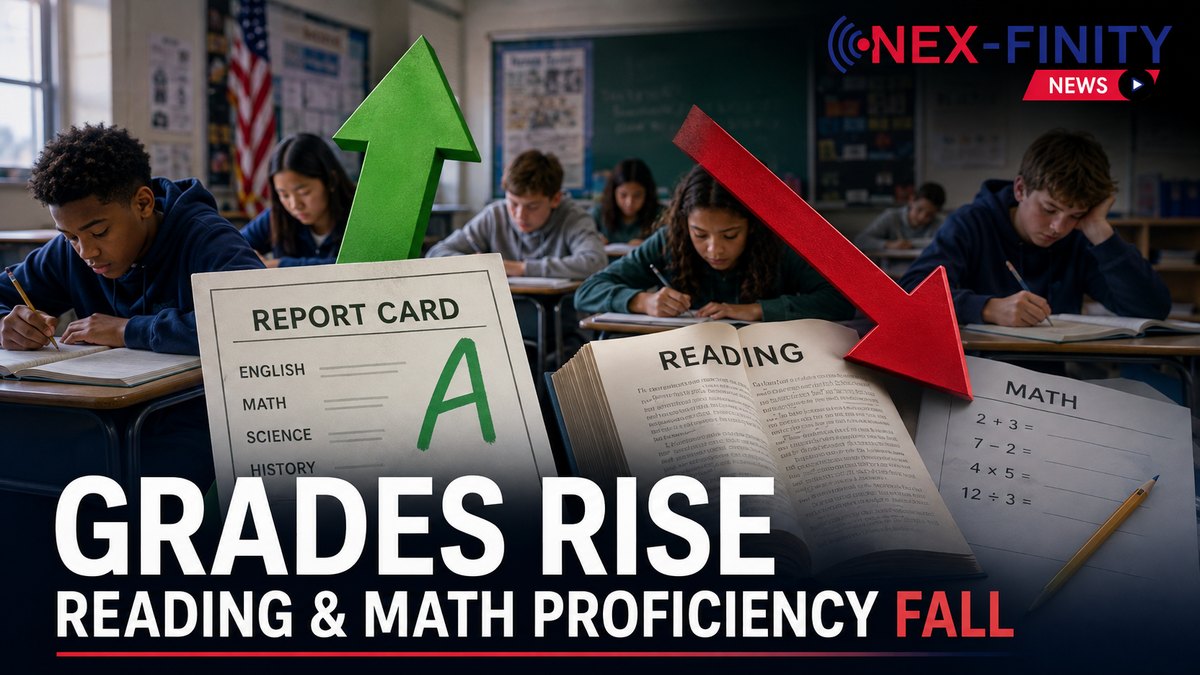
On Tuesday, Aug. 12, Metro Nashville Public Schools leaders presented state test data to the district’s board and described some of the highest academic achievement levels the district has recorded since Tennessee adopted more rigorous standards. Social studies proficiency in grades 3 through 8 rose 4.1 percentage points to 42.1 percent. Superintendent Adrienne Battle called the results a product of focus and belief.
At that same board meeting, a former teacher stood up and told the board the numbers were not real.
Samira Hardcastle, named 2025-2026 Teacher of the Year at John F. Kennedy Middle School and a district Blue Ribbon honoree, resigned in May after eight years. In her resignation letter and in her remarks to the board, she alleged that district administrators directed grade changes for failing students. The following day, WSMV4 Investigates reporter Jeremy Finley published internal emails and documents showing a second former teacher John Overton High School math teacher Diana Wills raising the same objection through official channels.
The district disputes both accounts. What neither side disputes is the underlying arithmetic problem that makes the allegation plausible enough to investigate: MNPS graduated 83.6 percent of the class of 2025, while roughly a third of its students met state proficiency benchmarks in reading and math.
That gap is not unique to Nashville. It is the central unresolved question in American public education, and almost no one at the senior administrative level is ever asked to answer for it.
Background: What the Documents Show
Hardcastle’s account, as reported by WSMV, involves a student who did not complete an art project and received a failing grade. The student’s parent challenged it. Three district administrators met with the parent and concluded Hardcastle had not supplied an adequate rubric for the assignment. She was told to change the grade.
She refused. According to her account, administrators changed it themselves.
Asked why, Hardcastle offered a one-sentence theory: “It makes our scores look better.”
Wills’ case ran on a different mechanism. Administrators told her she had failed students without notifying their parents beforehand, as district policy requires, and that the procedural lapse meant she needed to convert those failures into D’s. Wills pushed back in writing, noting that one student had been repeatedly told to make up exams and never did, and that she had been on medical leave for much of the semester in question. In one email she wrote that administrators were latching onto vague policy language to “cook the books to have the data look the way you need it to.”
MNPS responded to WSMV by email after declining an on-camera interview across three days of requests. A district spokesman characterized the Wills matter as a difference of opinion over policy interpretation and said the grade changes did not meaningfully affect the students’ final outcomes in those courses. On Hardcastle’s allegation, the spokesman said her claim “does not fully reflect what occurred,” noting there was no written schoolwide policy at the time barring the student from completing the work, and that the student ultimately finished the project and received a grade.
Both positions can be partially true at once. That is what makes this a structural story rather than a personnel story.
Policy Explanation: Who Actually Owns a Grade
In simple terms: in Metro Nashville, the teacher who observed the work is not the person with final authority over what the work was worth.
According to the emails WSMV obtained, principals hold the final decision in grade disputes between teachers and administrators. That is not a rogue practice. Grade-appeal structures exist in most large districts, and they exist for defensible reasons teachers make errors, grading can be arbitrary, and families need recourse.
But an appeal process designed to correct individual injustice becomes something else when it operates inside an accountability system that measures administrators on aggregate outcomes. Tennessee districts are evaluated on proficiency rates, growth scores under the Tennessee Value Added Assessment System, and graduation rates. MNPS has publicized Level 5 TVAAS growth ratings and record graduation figures as evidence of institutional performance. Those metrics roll up to the superintendent’s office, to the board, and into the district’s public case for funding and confidence.
The teacher carries the professional judgment. The administrator carries the number. When those two things conflict, the structure gives the number the final word.
Examples: This Is Not Nashville’s First Case
Tennessee has already litigated a version of this. In 2024, a grade-fixing scandal at Clinton High School in Anderson County ended with the resignation of the principal and the departure of the head football coach, two teachers and three counselors. The mechanism was the school’s online credit recovery program. One fired teacher told school officials she was responsible for 485 score changes, many of them the result of skipping questions until a target grade appeared. A second teacher acknowledged changing more than 1,000 grades over four months.
Local board members declined to take questions from parents who showed up to ask about it.
By March 2025, state legislators had filed a bill addressing grade changes an implicit acknowledgment that existing Tennessee law did not clearly govern who may alter a recorded grade or under what circumstances.
The pattern extends well beyond Tennessee. Grade-floor policies that prohibit scores below 50 percent, credit recovery software that permits unlimited retakes, and district discipline-reporting practices that suppress documented behavioral incidents all operate on the same logic: the measured output improves without the underlying input changing.
Hardcastle raised the discipline piece directly at the board meeting, telling members that behavioral incidents had not declined but that teachers were discouraged from reporting them. Nexfinity News has not independently verified that claim, and MNPS has not addressed it publicly.
Impact: The Diploma-Skill Divergence
The national data makes the pattern hard to attribute to any single district’s misconduct.
Results from the 2024 National Assessment of Educational Progress, released in September 2025, showed 12th-grade reading and math scores at their lowest levels since the assessments began. Thirty-two percent of high school seniors scored below the NAEP Basic level in reading 12 percentage points worse than the 1992 baseline. In math, 45 percent fell below Basic. Both figures were the largest ever recorded on those assessments. Only 35 percent reached proficiency in reading; 22 percent did so in math.
Meanwhile, more than half of those same seniors reported acceptance to a four-year college. Testing officials estimated 33 percent were ready for college-level math, down from 37 percent in 2019.
Matthew Soldner, acting commissioner of the National Center for Education Statistics, called the results sobering and noted that the steepest declines among the lowest-performing students predate the pandemic.
Grades moved in the opposite direction. An ACT analysis covering 2010 through 2022 found average adjusted GPAs rose from 3.02 to 3.32 in math and from 3.17 to 3.39 in English. By 2022, more than 89 percent of high school students were receiving A’s or B’s in math, English, social studies and science. Federal transcript data shows the average GPA of a high school graduate climbed from 2.68 in 1990 to 3.11 in 2019.
Tennessee’s statewide graduation rate hit 92.3 percent for the class of 2025, a record. Nashville’s was 83.6 percent.
In simple terms: the credential is inflating while the competency behind it deflates. Those two lines have been diverging for roughly three decades.
The Money Question: More Spending, More Staff, Flat Results
If outcomes were purely a resource problem, the last two decades should have solved it.
Nominal per-pupil spending in American public schools rose 94 percent between 2003 and 2022, from $8,044 to $15,591, according to National Center for Education Statistics data. Adjusted for inflation, the real increase was 20.4 percent. K-12 education is the single largest category of non-federal government spending in the United States, consuming just over one-fifth of all state and local direct general expenditure.
Readers will encounter far more dramatic figures than 20.4 percent in political commentary on this subject claims of 150 percent or 245 percent increases are common. Those numbers are generally accurate but reach back to 1970, a baseline that predates federal special education mandates, and they are frequently quoted without the inflation adjustment that makes them meaningful. Nexfinity News is using the conservative, recent, inflation-adjusted figure deliberately. The argument does not require the inflated version.
Because even at 20.4 percent real growth, achievement did not follow. Twelfth-grade NAEP reading and math scores in 2024 were the lowest on record. Long-term trend assessments show 17-year-olds performing at roughly the same level as their counterparts in the early 1970s.
The staffing decoupling
The clearer pattern is in headcount rather than dollars.
Between 2000 and 2022, public school enrollment grew about 5 percent nationally. Teacher employment grew about 10 percent. Principals and assistant principals grew 39 percent. Administrative staff grew 95 percent roughly 19 times the rate of student growth. Kennesaw State University economist Ben Scafidi, examining a longer window, found administrators and non-teaching staff grew more than seven times faster than enrollment between 1950 and 2015.
In simple terms: the institution surrounding the classroom expanded far faster than the classroom did.
The complication that honest reporting requires
That statistic is real, and it is also routinely oversold.
A July 2026 analysis published by Education Next examined where public school staffing growth actually went over the past two decades. The three NCES categories that constitute central office staff officials and administrators, instructional coordinators, and administrative support staff accounted for 17.6 percent of total staffing growth. Instructional aides and student support staff together accounted for 51.7 percent. Between 2007 and 2023, special education staff alone accounted for an estimated 40.4 percent of all new public school employees.
Much of what gets labeled “administrative bloat” is federally mandated special education staffing, English learner support, and school mental health personnel. Those positions exist because Congress, courts and parents demanded them. Districts did not invent them to pad payroll.
Nashville specifically resists the overspending narrative. Tennessee ranks last among all states in per-pupil expenditure, spending $12,147 per student in average daily attendance in 2024-25 against a national average of $17,840, according to National Education Association data a 9.8 percent single-year decline and the steepest in the country. MNPS operates a roughly $1.3 billion budget for approximately 81,500 students, and of the $55.9 million increase in its FY27 budget, the district reports more than 70 percent goes directly to employee compensation, including step increases, benefits and the citywide cost-of-living adjustment.
Whatever is wrong in Nashville, “the district is drowning in money” is not a defensible description of it.
The finding that survives all of it
Here is the number that does not go away.
Between 2021 and 2024, the federal government sent roughly $190 billion to American school districts through the Elementary and Secondary School Emergency Relief fund the largest one-time federal investment in K-12 education in the nation’s history, with about 90 percent routed directly to local districts under minimal federal or state oversight.
Researchers at Harvard’s Center for Education Policy Research and Stanford’s Educational Opportunity Project measured what it bought. Every $1,000 spent per pupil produced an average gain of 0.0086 standard deviations in math and 0.0045 in reading the equivalent of roughly six days of additional learning in math and three days in reading. The effect was real and concentrated in high-poverty districts, and the researchers concluded the money prevented a steeper collapse. They also concluded there were higher-impact ways to spend it, noting that states were required to direct only 20 percent of the funds toward academic recovery at all.
By one estimate derived from those effect sizes, restoring students to 2019 achievement levels through spending alone would require an additional $450 billion to $650 billion roughly $9,000 to $13,000 more per student.
That is the honest state of the evidence. Money is not irrelevant to student achievement; the research literature is clear that it matters, particularly for poor children. But the return on the marginal dollar, as districts currently deploy it, is close to negligible and nobody is required to explain why.
Analysis: The Reasoning Gap Employers Are Describing
Where this lands is the labor market, and the reporting there is softer than the test data but consistent.
Employer surveys over the past two years have converged on the same complaint, and notably it is rarely about technical knowledge. An April 2026 survey of 1,000 hiring managers found that eight in ten reported a recent college graduate did not work out at their company within the past year, and 65 percent said they had to fire one. Research conducted for Hult International Business School with Workplace Intelligence, surveying 800 HR leaders and 800 recent-graduate employees, found 78 percent of HR leaders had already dismissed some recent hires. Separate industry surveys have found employers ranking communication, collaboration and critical thinking as their top requirements and reporting those as the specific deficits.
Readers should weigh these findings with appropriate caution. Most are self-reported perception surveys commissioned by career-services, résumé and business-education firms, which have a commercial interest in a skills-gap narrative. Every generation of managers has complained about the one behind it. These are not government statistics, and they do not establish causation.
But two things sit uncomfortably together. The federal assessment data which is methodologically rigorous and carries no commercial interest shows a measurable, decades-long decline in the specific capacity NAEP describes as drawing general conclusions from information presented explicitly in a text. And employers describe a workforce that struggles to reason through ambiguity and communicate a position.
Those are the same skill.
A grade change does not create that gap. Grade inflation is a symptom of the incentive structure, not the disease. But it does something specific and corrosive: it removes the signal that would tell a student, a parent, a college or an employer that the gap exists. A student who cannot analyze a text and receives a D instead of an F does not learn to analyze a text. He learns that the consequence he was warned about does not arrive.
Hardcastle put it to the board in the form of a question about what happens when students advance without earning it and later become teachers, police officers or politicians. It is a rhetorical question. It is also, functionally, an empirical one that no district in the country is currently structured to answer.
The Accountability Asymmetry
Here is the part that deserves more scrutiny than it typically receives.
When outcomes are poor, the accountability apparatus points downward. Teacher evaluations, classroom observation rubrics, value-added scores attached to individual instructors, and school-level letter grades all locate responsibility at the point of instruction. When a district reports gains, the accountability apparatus points upward superintendents, chief academic officers and boards claim the improvement as evidence of strategy.
Both directions cannot be right.
In the Nashville case as reported, two teachers exercised the professional judgment their evaluation system is built to measure, and the institutional response was a disciplinary action in one instance and a suspension in the other. No senior administrator has been identified, disciplined or asked to explain the directive under oath. The district answered a three-day interview request by email.
This is not an argument that Nashville’s administrators fabricated a districtwide record. MNPS’s TCAP gains are drawn from state-administered assessments that individual schools do not score, and the district’s improvement on those instruments is real as measured. It is an argument that no functioning system permits the party graded on a number to also control the inputs to that number without independent verification and that this is precisely the arrangement American school districts operate under.
Public companies are not permitted to audit themselves. Districts are.
The same asymmetry governs money. When a district requests a budget increase, the case is made in terms of student need more counselors, more aides, more tutoring, more mental health support. When achievement fails to move, the explanation offered is almost never that the previous increase did not work. It is that the increase was insufficient.
The $190 billion ESSER experiment was the most rigorously measured spending event in the history of American public education, and it returned single-digit days of learning per thousand dollars per student. That result should have triggered a national reassessment of how districts allocate marginal resources. Instead, most districts spent the wind-down period lobbying to convert expiring federal programs into permanent local line items which is precisely what Nashville did, dedicating $64.5 million in Metro operating funds to sustain services originally financed by ESSER.
That may well have been the right call. Cutting tutoring and mental health staff mid-recovery has costs of its own. But the decision was made without any public accounting of whether those specific programs had produced measurable results in Nashville, because no mechanism required one.
A superintendent who raises graduation rates is credited with leadership. A superintendent whose graduating class cannot read at grade level is described as facing challenges. Both statements can be issued by the same office in the same year about the same students, and routinely are.
Conclusion
Two former Nashville teachers have made a specific, documented allegation. One is suing. The district denies the characterization. That dispute will be resolved, or not, through litigation and whatever oversight the Tennessee Department of Education and the Metro Nashville school board choose to apply.
The larger question survives the outcome of that case. A system that graduates 83 percent of its students while a third demonstrate proficiency has a measurement problem, an instruction problem, or both and the institutional incentive runs toward treating it as a measurement problem, because measurement problems are cheaper to solve.
The spending record makes that incentive stronger, not weaker. Two decades of real per-pupil increases, a doubling of administrative headcount against flat enrollment, and the largest emergency education appropriation in American history produced achievement scores at or below where they stood in 1992. The available conclusion is not that schools need less money. It is that the system currently has no mechanism for determining what any of it purchased, and no consequence attached to the answer.
The students carrying those diplomas will discover the difference at their first job. Their employers already have.
Key Takeaways
· Two former Metro Nashville Public Schools teachers allege administrators directed them to change failing grades. Neither was fired: Samira Hardcastle resigned in May; Diana Wills was suspended and is suing the district.
· MNPS denies the characterization, saying one case involved a policy disagreement that did not meaningfully change final outcomes and the other does not fully reflect what occurred.
· The allegations surfaced one day after the district presented record academic results to its board.
· MNPS graduated 83.6 percent of the class of 2025; roughly a third of students met state proficiency benchmarks in reading and math.
· Nationally, 2024 NAEP results showed the highest-ever share of 12th graders below Basic in both reading (32 percent) and math (45 percent), while average GPAs and graduation rates hit records.
· Tennessee has an existing precedent: a 2024 Clinton High School credit-recovery scandal involving more than 1,400 documented grade changes across two teachers.
· Real per-pupil spending rose 20.4 percent nationally between 2003 and 2022 (94 percent nominal), while administrative staff grew 95 percent against 5 percent enrollment growth since 2000.
· The bloat narrative requires qualification: central office positions accounted for only 17.6 percent of staffing growth, while special education alone accounted for roughly 40 percent of new hires between 2007 and 2023.
· Tennessee ranks last nationally in per-pupil spending at $12,147 versus a $17,840 national average, which makes “Nashville overspends” an unsupportable framing.
· The $190 billion ESSER program returned roughly six days of additional math learning and three days of reading per $1,000 per pupil the clearest available evidence that the marginal education dollar currently buys very little.
· Employer surveys consistently identify communication, critical thinking and work ethic not technical knowledge as the primary gaps in recent graduates, though these are perception surveys with commercial sponsors and should be read accordingly.
Sources
1. Jeremy Finley, “2 former Metro Nashville teachers say administrators directed them to change failing grades,” WSMV4 Investigates, Aug. 13, 2026.
2. “Metro Nashville students make major TCAP gains, district highlights years of academic progress,” WSMV, Aug. 12, 2026.
3. Tennessee Department of Education, 2024-25 graduation rate data, released Oct. 27, 2025.
4. National Assessment of Educational Progress, Grade 12 Reading and Mathematics 2024 results, National Center for Education Statistics, released Sept. 9, 2025.
5. NAEP Reading Grade 12 National Trends, nationsreportcard.gov.
6. National Assessment Governing Board, “Top 5 Takeaways from 12th Grade NAEP Math and Reading Results.”
7. ACT grade inflation study, 2010-2022 GPA analysis.
8. NCES high school transcript study, average graduate GPA 1990-2019.
9. “Tennessee bill would sanction grade changes,” Tennessee Lookout, March 18, 2025.
10. Hult International Business School / Workplace Intelligence, College Graduate Skills Study.
11. ResumeTemplates.com hiring manager survey, April 2026.
12. Metropolitan Nashville Public Schools, district performance statements and FY27 budget summary, mnps.org.
13. NCES Digest of Education Statistics, per-pupil spending 2003-2022 and staff employed in public elementary and secondary school systems, Fall 2000-Fall 2022.
14. “The Propulsive Growth of Non-Teaching School Staff,” Education Next, July 2026.
15. Ben Scafidi, “The School Staffing Surge: Decades of Employment Growth in America’s Public Schools.”
16. Daniel Dewey, Erin Fahle, Thomas J. Kane, Sean F. Reardon and Douglas O. Staiger, ESSER spending effects analysis, Center for Education Policy Research (Harvard) and the Educational Opportunity Project (Stanford).
17. “Tennessee’s public school funding drops to lowest in the U.S.,” Nashville Banner, April 29, 2026, citing National Education Association data.
18. Metropolitan Government of Nashville and Davidson County, FY2026 Operating Budget Executive Summary.